

A gigawatt of “capacity” is not a gigawatt of product. It is a theoretical ceiling — the output a production line would generate if every wafer that entered the line came out the other end as a saleable, in-specification cell. In practice, no factory works that way. Wafers break. Cells fall outside efficiency bins. Metallisation misprints. Some units fail electroluminescence (EL) inspection and get scrapped or reworked. The gap between what a line could theoretically produce and what it actually ships is manufacturing yield, and it is one of the least discussed but most consequential numbers in the entire solar value chain.
Two factories can announce identical 1 GW annual capacity, buy the same tools from the same equipment vendors, and still end up with meaningfully different unit economics — because one runs at 97% yield and the other at 91%. That six-point gap doesn’t show up in a capacity announcement. It shows up in cost per watt, in delivery reliability, and eventually in the price a module maker or EPC pays for cells.
What “Manufacturing Yield” Actually Means
In solar cell production, yield is usually tracked at more than one stage:
- Wafer-to-cell yield — the percentage of incoming wafers that survive processing (diffusion, texturing, passivation, metallisation) without breaking or being scrapped for defects.
- Cell efficiency-bin yield — the percentage of finished cells that fall into the target efficiency and quality bins the factory is selling against, rather than being downgraded into lower-value bins or rejected outright.
- Line/equipment yield (uptime) — how much of the scheduled production time the tools are actually running versus down for maintenance, recipe changeovers, or quality holds.
A factory’s effective output is the product of all three. A line with 98% wafer survival, 95% efficiency-bin pass rate and 92% equipment uptime is not running at “close to 100%” — its combined effective yield is closer to 86%. Multiply that gap across a full year of production and it becomes a large volume of silicon, chemicals, labour and depreciation that produced no sellable watt at all.
Where the Losses Actually Happen
Wafer breakage. Silicon wafers are thin — modern M10 and G12 formats are typically in the 130–160 micron range — and they pass through dozens of handling, loading and thermal-shock steps between an incoming wafer and a finished cell. Breakage tends to cluster around texturing/cleaning baths, diffusion furnace loading, and screen-printing alignment, where mechanical handling stress is highest.
Process losses. Diffusion uniformity, passivation layer quality (critical for TOPCon’s tunnel-oxide layer), and texturing consistency all affect how many cells land within the target electrical specification. A furnace running slightly outside its process window doesn’t necessarily produce a visibly broken cell — it produces a cell that quietly underperforms and gets binned lower or rejected at EL testing.
Metallisation losses. Screen-printing the front and rear metal contacts is one of the most yield-sensitive steps in the whole line. Misalignment, paste under- or over-application, and firing-profile drift all show up later as resistive losses, shading losses, or visible print defects — the kind of issues covered in detail in Websol’s explainer on EL testing, binning and batch consistency.
Efficiency distribution. Even a well-controlled line produces a spread of cell efficiencies, not a single number. A factory advertising “up to 22.8% efficiency” is describing its best bin, not its average output. The width of that distribution — how tightly clustered the cells are around the top bin — is itself a yield and process-control metric.
Rework and scrap. Not every deviation is a total loss. Some cells can be reworked (re-cleaned, re-fired, re-sorted); others are scrapped for material recovery. Rework consumes extra cycle time and energy without adding capacity, which is a hidden cost that doesn’t appear in headline GW figures.
Equipment uptime. Planned maintenance, unplanned breakdowns, and the time lost during recipe changeovers (for example, switching a line between cell formats or busbar counts) all reduce the number of wafers a line can process in a given year, independent of how well those wafers perform once processed.
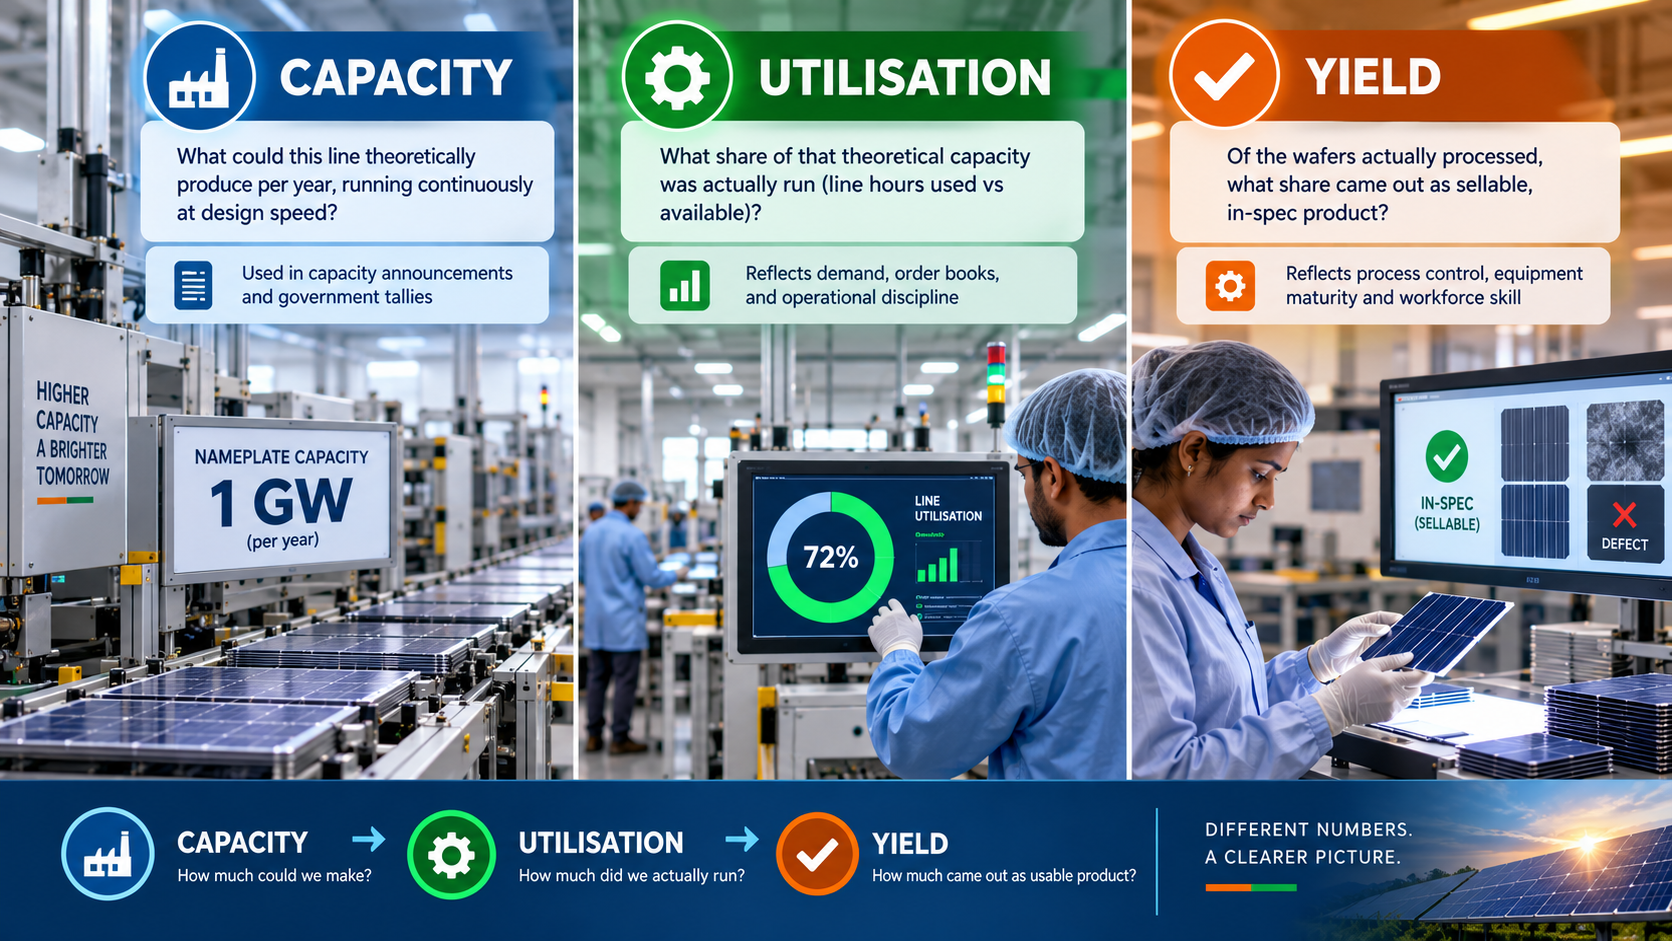
Capacity vs Utilisation vs Yield: Three Different Numbers
These three terms get used loosely in industry reporting, but they answer different questions:
|
Metric |
What it answers |
Why it matters |
|
Nameplate capacity |
What could this line theoretically produce per year, running continuously at design speed? |
Used in capacity announcements and government tallies |
|
Utilisation |
What share of that theoretical capacity was actually run (line hours used vs available)? |
Reflects demand, order books, and operational discipline |
|
Yield |
Of the wafers actually processed, what share came out as sellable, in-spec product? |
Reflects process control, equipment maturity and workforce skill |
India’s own manufacturing data illustrates why this distinction matters at a national level, not just a factory level. By the end of 2025, India’s cumulative module manufacturing capacity had reached roughly 210 GW, while cell manufacturing capacity stood at around 27 GW — a stark reminder that installed capacity figures say nothing about how much of that capacity is running, at what yield, and against what quality standard. A national capacity number is a policy signal; it is not a production forecast.
Why Two Identical-Capacity Factories Can Have Very Different Economics
Imagine two 2 GW/year cell lines, built with comparable tooling, both quoted at the same headline capacity.
- Factory A runs at 93% equipment uptime, 97% wafer survival and a tight efficiency distribution concentrated in its top two bins. Its effective sellable output is close to 1.85 GW/year of premium-bin product.
- Factory B runs at 85% uptime (more unplanned downtime, slower changeovers), 92% wafer survival, and a wider efficiency spread with a larger share of cells falling into lower bins. Its effective sellable output might land closer to 1.55 GW/year, with a meaningfully higher proportion sold at a discount.
The two factories consumed almost the same amount of silicon, chemicals, electricity and depreciation to get there. Factory B’s real cost per watt is higher — not because its equipment was worse, but because a larger share of its inputs never became a sellable watt. This is the central reason procurement teams evaluating cell suppliers should ask about yield and batch consistency, not just quoted efficiency, a point developed further in Websol’s guide to choosing a solar cell supplier.
How Process Control and Automation Improve Yield
Yield improvement is rarely one dramatic fix — it is usually the accumulation of many small process-control gains:
- Statistical process control (SPC) on furnace temperature profiles, paste deposition weight, and texturing bath chemistry catches drift before it produces a batch of out-of-spec cells.
- Automated material handling reduces the mechanical stress events that cause wafer breakage, since robotic wafer transfer is more repeatable than manual handling. Websol’s own account of how automation is reducing solar production costs covers this in more depth.
- In-line EL and I-V testing at multiple stages (not just final inspection) allows defects to be caught and corrected earlier in the process, before more value has been added to a bad wafer.
- Recipe standardisation across shifts and operators reduces the variability that comes from human judgment calls on borderline units.
- Preventive maintenance scheduling, rather than run-to-failure maintenance, protects uptime — the “utilisation” side of the yield equation.
None of these are exotic. What separates high-yield fabs from average ones is usually discipline and measurement — a willingness to track yield loss by process step, rather than reporting a single blended number.
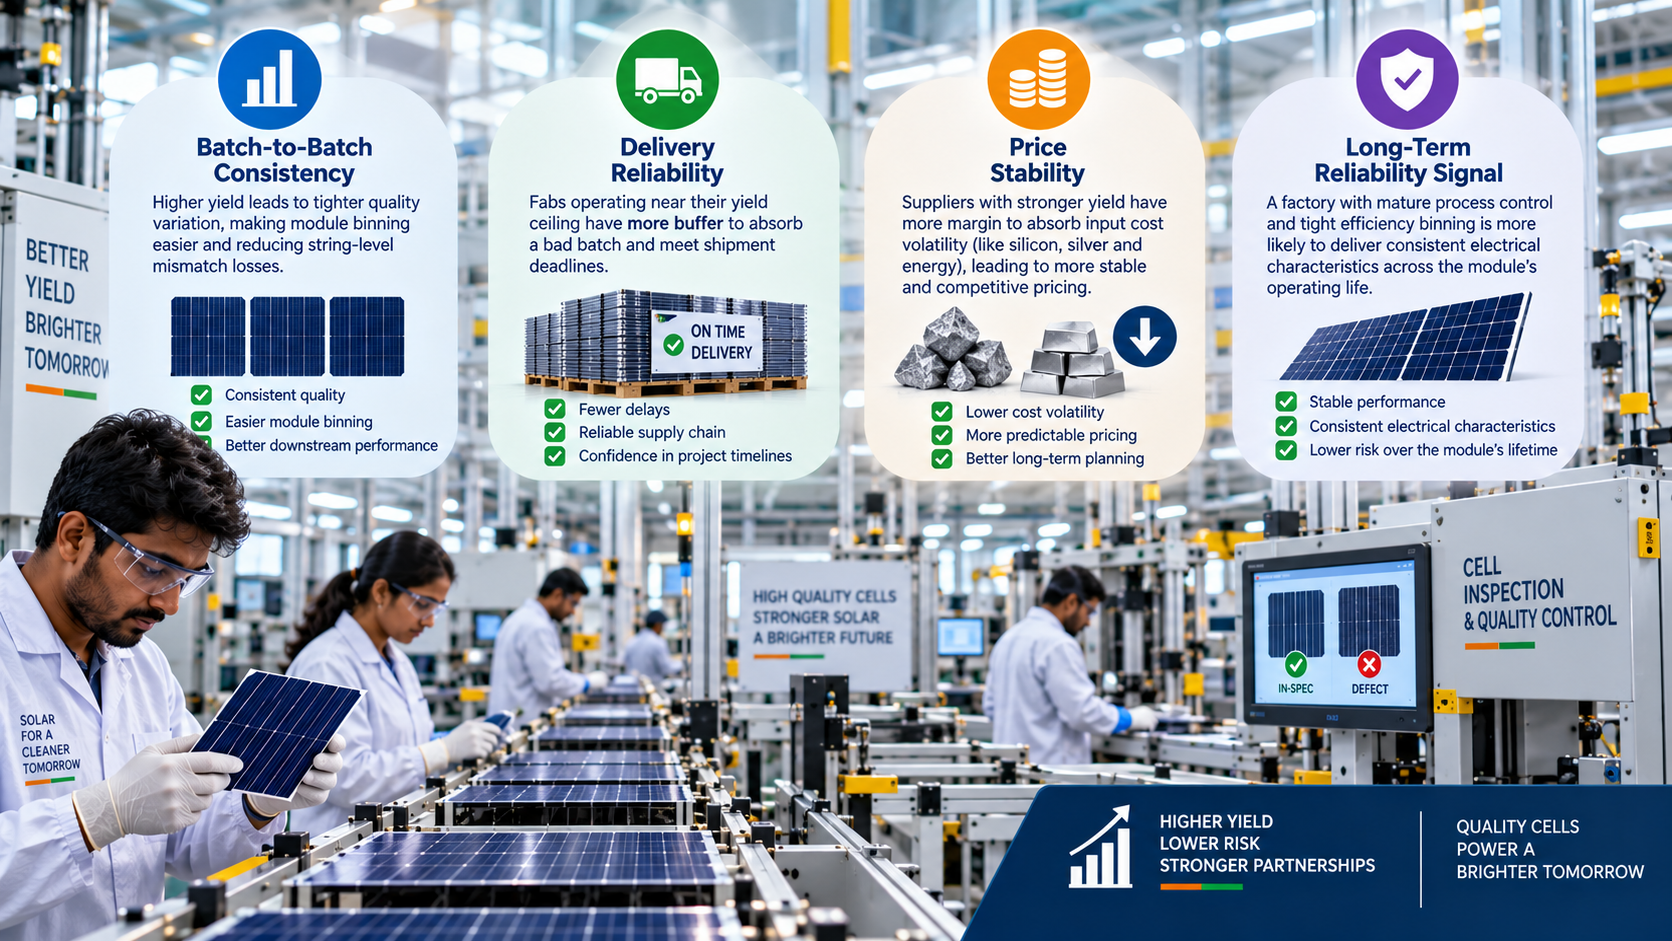
Why Yield Ultimately Decides Module Economics and Procurement Risk
For a module manufacturer or EPC buying cells, a supplier’s yield discipline shows up indirectly, in ways that matter commercially:
- Batch-to-batch consistency. Low-yield fabs tend to have wider quality variation between batches, which complicates module binning and can affect string-level mismatch losses downstream — a topic covered in Websol’s explainer on the cell-to-module efficiency gap.
- Delivery reliability. A fab running near its yield ceiling has less buffer to absorb a bad batch without missing a shipment date.
- Price stability. Suppliers with structurally low yield have less margin to absorb input cost volatility (silicon, silver, energy), which can translate into more volatile quoted prices — and silver consumption in particular is a growing share of cell cost, as explained in Websol’s article on why silver matters in solar cell manufacturing.
- Long-term reliability signal. A cell factory with mature process control and tight efficiency binning is also more likely to have consistent electrical characteristics across the module’s operating life — relevant to anyone evaluating how solar cells are manufactured and where quality is actually built in.
Key Takeaways
- Manufacturing yield is the share of processed wafers that become sellable, in-spec cells — it is distinct from nameplate capacity and from utilisation.
- Losses accumulate across wafer handling, diffusion/passivation, metallisation, binning and equipment uptime.
- Two factories with identical GW capacity can have meaningfully different real costs per watt if their yields differ.
- Automation, statistical process control and in-line testing are the main levers for improving yield.
- For buyers, a supplier’s yield discipline is a proxy for delivery reliability and batch consistency, not just headline efficiency.
Understanding manufacturing yield is one part of evaluating any solar cell supplier’s real capability — alongside process transparency, batch consistency and quality documentation. Websol Energy System Ltd, an Indian solar cell manufacturer, shares its own manufacturing practices and process details for buyers who want to look beyond headline capacity numbers when evaluating cell suppliers.