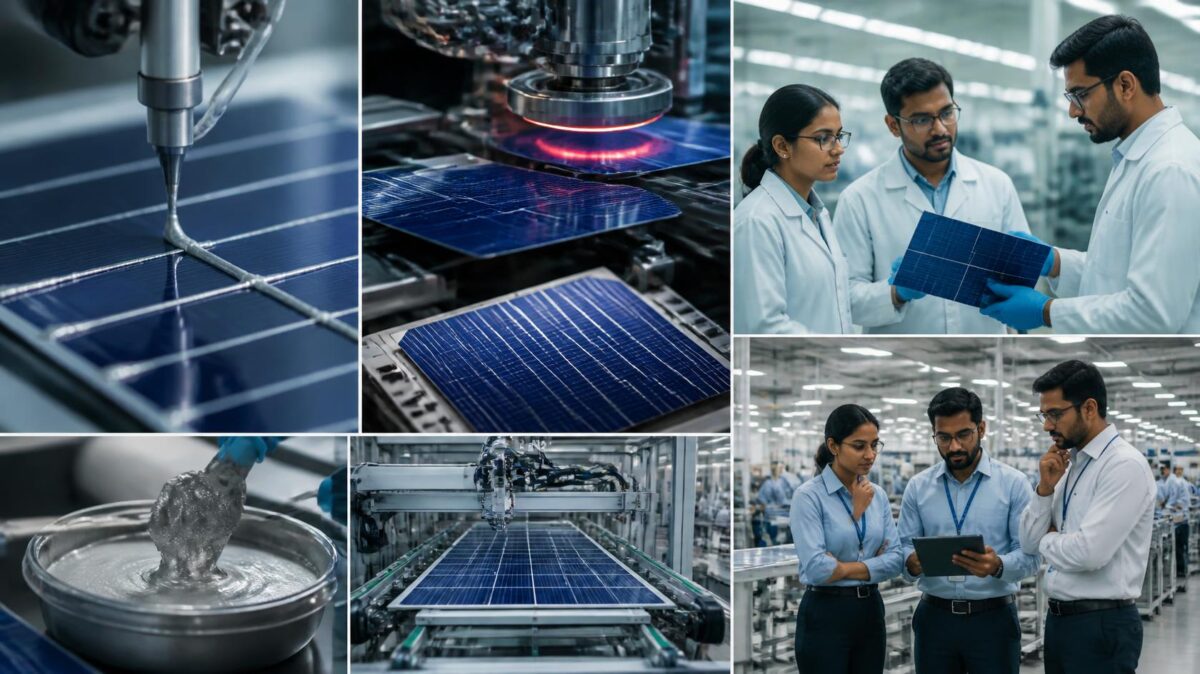
Why Silver Matters in Solar Cell Manufacturing — and How Manufacturers Are Reducing Silver Consumption

Why Silver Matters in Solar Cell Manufacturing — and How Manufacturers Are Reducing Silver Consumption

Silver isn’t a minor input in solar cell manufacturing — it’s one of the largest cost drivers procurement teams rarely ask about. When silver prices swing, cell prices follow, often faster than developers expect. Understanding why silver is used at all, and how the industry is working to use less of it, is genuinely useful context for anyone negotiating cell or module supply in the current market.

Quick Answer

Silver paste is used to print the fine conductive grid lines (fingers and busbars) that collect electrical current from a solar cell’s surface — no cost-effective, high-conductivity alternative has fully replaced it at scale yet. Silver paste now accounts for up to 30 percent of total solar cell production costs, and with silver prices at record highs through 2025–26, manufacturers across the industry have been aggressively “thrifting” — reducing silver use per cell through thinner printing, tighter tolerances, and technology shifts — even as total industry silver demand keeps climbing due to overall solar deployment growth.

Why Solar Cells Need Silver At All

A solar cell generates current across its entire surface, but that current needs to be collected and routed to the cell’s edge for connection into a module circuit. This is done through a printed metallic grid — fine “finger” lines and larger “busbars” — and silver is used because it offers the best available combination of high electrical conductivity and compatibility with the low-temperature, high-throughput screen-printing processes used in mass cell manufacturing.

Copper is more abundant and far cheaper, but pure copper paste solutions have historically struggled with adhesion, oxidation, and print-quality issues at the temperatures and speeds solar manufacturing requires. Pure copper paste solutions are not yet technically mature — which is precisely why silver, despite its cost, has remained the industry’s default metallization material.

The Scale of the Silver Problem

Solar panel manufacturing consumed 186.6 million ounces of silver in 2025, while global mine production totaled 846.6 million ounces — meaning the photovoltaic industry alone used approximately 22 percent of all silver mined worldwide. That’s an extraordinary concentration of a single global commodity flowing into a single industrial application.

Pricing has responded accordingly. Silver futures hit a record high overnight, reaching $80 an ounce for the first time at the end of December 2025. A separate record was noted at $83.62 per ounce on December 28 as the price surge continued into early 2026. Solar module manufacturers in India currently have limited ability to raise panel final prices, which is accelerating efforts to reduce silver use across all mainstream cell technologies.

Silver Consumption by Cell Technology

Cell Technology

Approx. Silver Use (mg/cell or mg/W)

Trend

TOPCon

~86 mg per cell (down 21.1% y-o-y per CPIA 2025 data)

Declining, active thrifting focus

HJT (heterojunction)

~75 mg per cell, down 34.8% y-o-y — lowest among mainstream n-type technologies

Declining fastest among n-type

Back-contact (BC)

~135 mg per cell, remains the highest among mainstream technologies

Highest, thrifting harder due to design complexity

Mono-PERC

Historically ~9 mg/W baseline, with continued reduction efforts

Declining, mature thrifting curve

Figures reflect industry-reported estimates as of early-to-mid 2026 and vary by manufacturer, process generation, and reporting methodology.

How Manufacturers Are Cutting Silver Use

Thrifting through process optimisation. Manufacturers achieve reduced silver use through thinner paste layers, tighter printing tolerances, and more efficient cell designs — this is the primary near-term lever, requiring no fundamental materials change, just tighter process control over existing screen-printing equipment.

Silver-coated copper paste. Silver-coated copper pastes are currently the most effective immediate approach to reducing silver consumption, though they do not eliminate silver use entirely — this hybrid approach uses a thin silver coating over a copper core, cutting the actual silver content substantially while retaining much of silver’s conductivity and print-process compatibility. This approach can reduce silver content by around 70 percent and is approaching mass-production viability in heterojunction cell manufacturing specifically.

Research-stage breakthroughs. At the far end of the innovation curve, Fraunhofer ISE researchers have succeeded in producing highly efficient silicon heterojunction solar cells with a minimal silver consumption of only 1.4 milligrams of silver per watt of peak power using screen printing for the solar cell metallization — undercutting the 2 mg/W long-term sustainability target calculated for global PV production at multi-terawatt scale. This remains a lab-scale result rather than mass-production reality, but it demonstrates how much headroom exists below current industry-average consumption figures.

Why “Less Silver” Doesn’t Mean “Solved”

Here’s the genuinely counterintuitive part of this story, and it matters for anyone tracking input-cost risk: solar photovoltaic manufacturers reduced silver consumption by 19% in 2026, cutting demand from 186.6 million ounces in 2025 to roughly 151 million ounces — yet the global silver market is still heading for its sixth consecutive annual supply deficit. When both silver demand and supply-side constraints move at a similar pace, the underlying deficit doesn’t actually shrink — it can even widen.

The practical implication: thrifting is reducing solar’s per-watt silver intensity meaningfully, but total industry silver demand is still rising in absolute terms because global solar deployment volumes are growing faster than the rate of per-cell silver reduction. This means silver price risk isn’t a temporary spike that thrifting will fully resolve — it’s a structural cost factor procurement teams should expect to keep managing over the medium term.

What This Means for Cell and Module Buyers

Ask suppliers about their silver-use trajectory, not just current pricing. A manufacturer actively investing in silver-coated copper paste or advanced printing processes is better positioned to absorb future silver price volatility without passing the full impact to buyers.

Expect cell pricing to remain sensitive to silver spot prices. With silver representing up to 30% of cell production cost, any multi-year supply contract should account for how silver price movement is handled — fixed pricing, indexed pricing, or periodic renegotiation clauses are all worth clarifying upfront.

Understand that technology choice affects silver exposure. Back-contact cells currently carry the highest silver intensity among mainstream technologies, which is a relevant factor — alongside efficiency and cost — when comparing cell technology options for a given project.

Mono-PERC technology, which Websol Energy System uses for its M10 Bifacial cells, sits toward the lower end of the silver-intensity spectrum among current mainstream cell technologies, reflecting a mature thrifting curve built over years of process refinement. Readers comparing cell technologies more broadly may find our piece on Mono-PERC versus TOPCon cells a useful companion read.

Frequently Asked Questions

Why can't manufacturers just switch entirely to copper instead of silver?

Pure copper paste currently faces technical challenges around adhesion, oxidation resistance, and compatibility with high-speed screen-printing processes at the temperatures solar manufacturing requires — it isn’t yet a fully mature, drop-in replacement at commercial scale, though research continues to advance.

Among current mainstream technologies, heterojunction (HJT) cells have shown the fastest year-on-year reduction in silver use per cell, though back-contact (BC) technology remains the highest silver-consuming mainstream format.

Silver paste has been reported to represent up to 30% of total cell production cost during periods of high silver pricing — a substantial share for a component that makes up a small fraction of the cell’s physical material by weight.

Per-cell and per-watt silver intensity is falling due to thrifting efforts, but total industry silver demand in absolute terms remains historically very high because overall global solar deployment volumes continue to grow.

Silver price volatility is likely to remain a factor in cell pricing for the foreseeable future, given the ongoing global silver supply deficit — though the pace of thrifting and adoption of silver-coated copper alternatives will influence how much of that volatility passes through to buyers.

How to Audit a Solar Cell Manufacturer Before Signing a Supply Contract

How to Audit a Solar Cell Manufacturer Before Signing a Supply Contract

A supplier’s brochure will always show you their best batch. A factory audit shows you their average one — and in a multi-year supply contract, average is what you’re actually buying. With India’s cell supply market tightening under ALMM List-II (see our breakdown of the current supply crunch), procurement teams are under real pressure to lock in suppliers quickly. That pressure is exactly when a structured technical audit matters most — rushed sourcing decisions are how weak suppliers get long-term contracts.

Quick Answer

Auditing a solar cell manufacturer before signing a supply contract should cover three layers: regulatory compliance (ALMM List-II status, certifications), manufacturing process control (EL testing, binning discipline, PID/LID performance data), and commercial capacity (production capacity versus committed order book, raw material supply chain, and financial stability). A thorough audit combines document review, factory visit, and independent third-party verification rather than relying solely on supplier-provided data.

The 15-Point Technical Audit Checklist

Regulatory & Compliance

  1. ALMM List-II status, verified independently. Don’t accept a supplier’s self-declared listing — cross-check the manufacturer name and specific cell model directly against the current MNRE ALMM List-II document, and confirm the revision date. Our detailed guide on ALMM List-II compliance requirements covers exactly what to verify and how.
  2. Certification currency, not just existence. IEC 61215 and IEC 61730 certifications expire and get revised — check the certificate’s issue date and scope, and confirm it applies to the specific cell model and production line you’ll be sourcing from, not just the company generally.
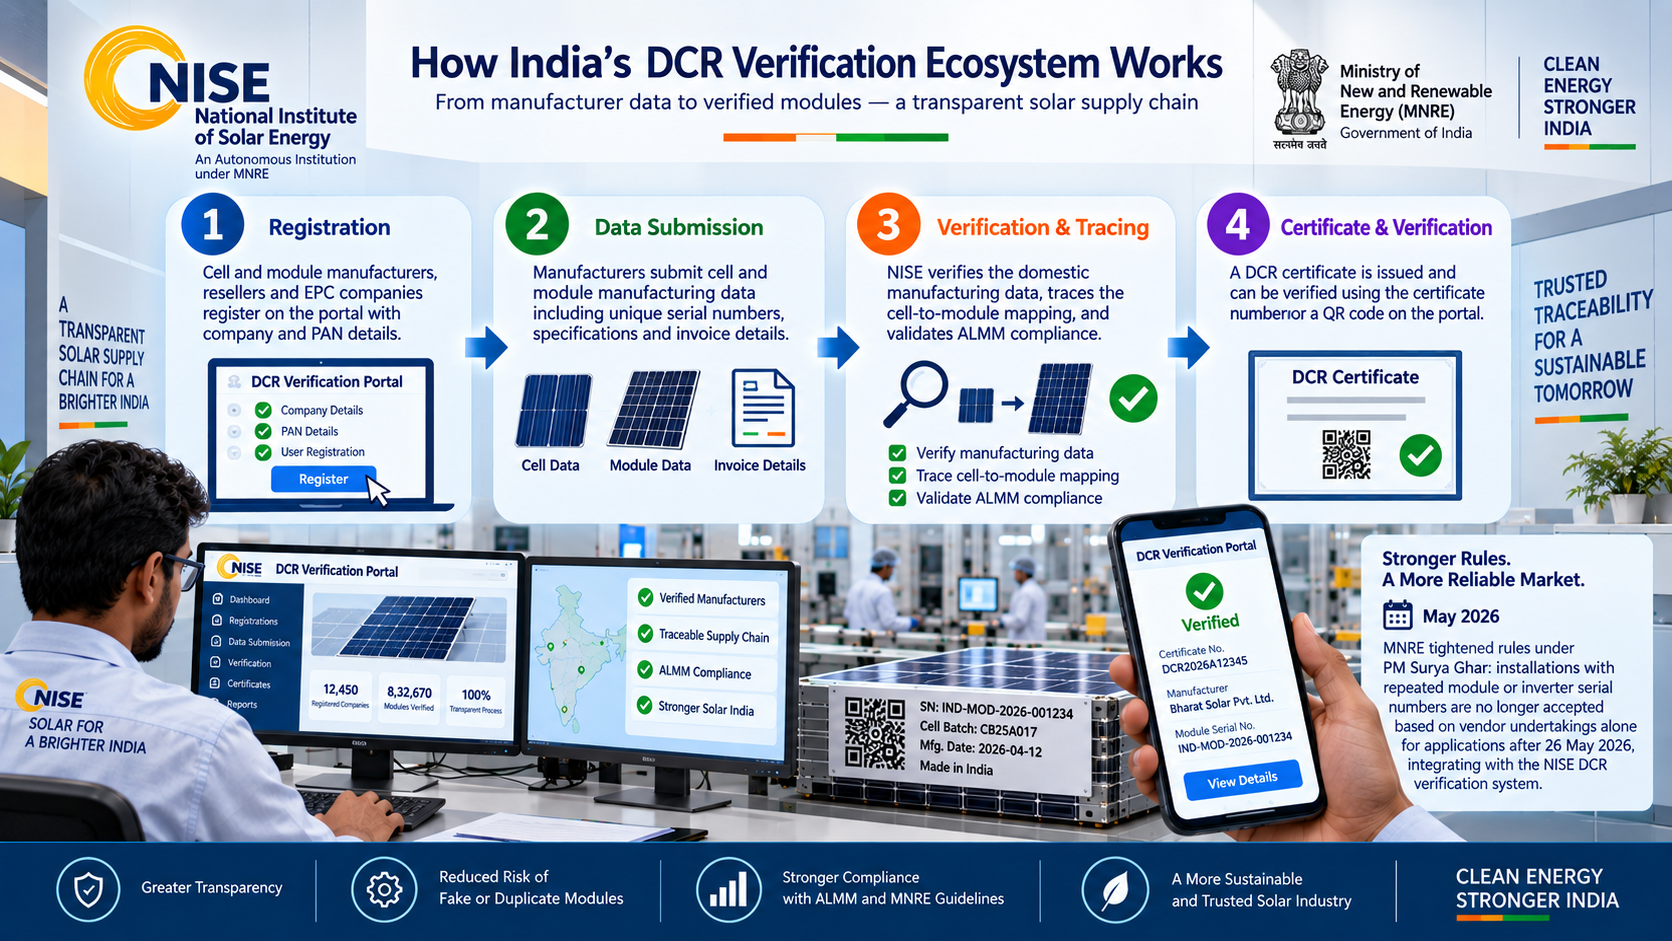
  3. Domestic value addition documentation. For DCR and ALMM-linked projects, confirm the supplier can provide documentation tracing raw material sourcing sufficient to satisfy domestic content requirements on your specific project type.

Manufacturing Process Control

  1. EL testing integration into the production line. Ask whether EL scanning happens as an inline, 100%-of-output quality gate or a sample-based spot check — these represent very different quality assurance postures. See our detailed explainer on EL testing, binning, PID and LID for what good practice looks like here.
  2. Binning distribution data. Request actual binning class distribution reports from recent production batches — a tight distribution around the rated efficiency class indicates strong process control; a wide spread is a red flag.
  3. PID test results per IEC 62804. Request third-party PID resistance test data, not just a manufacturer’s internal claim — this is one of the more commonly overstated specifications in supplier marketing material.
  4. LID/LeTID performance data. Ask specifically what wafer doping approach is used (boron vs. gallium-doped) and what LID mitigation processes are applied, along with supporting test data.
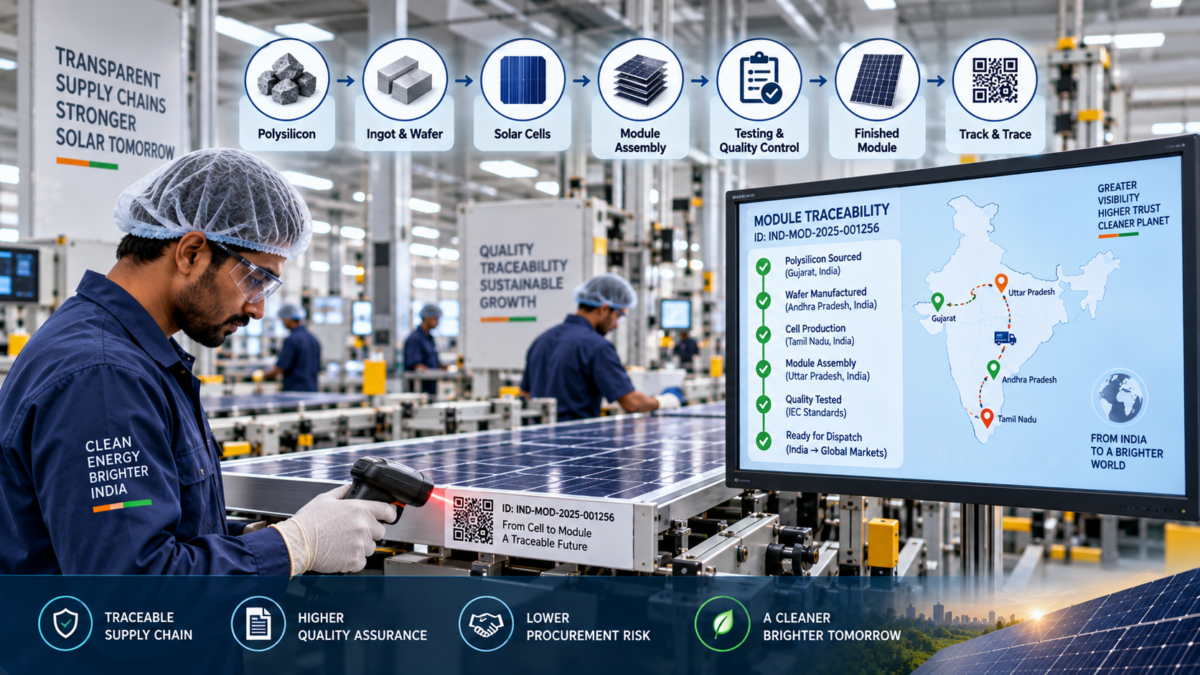
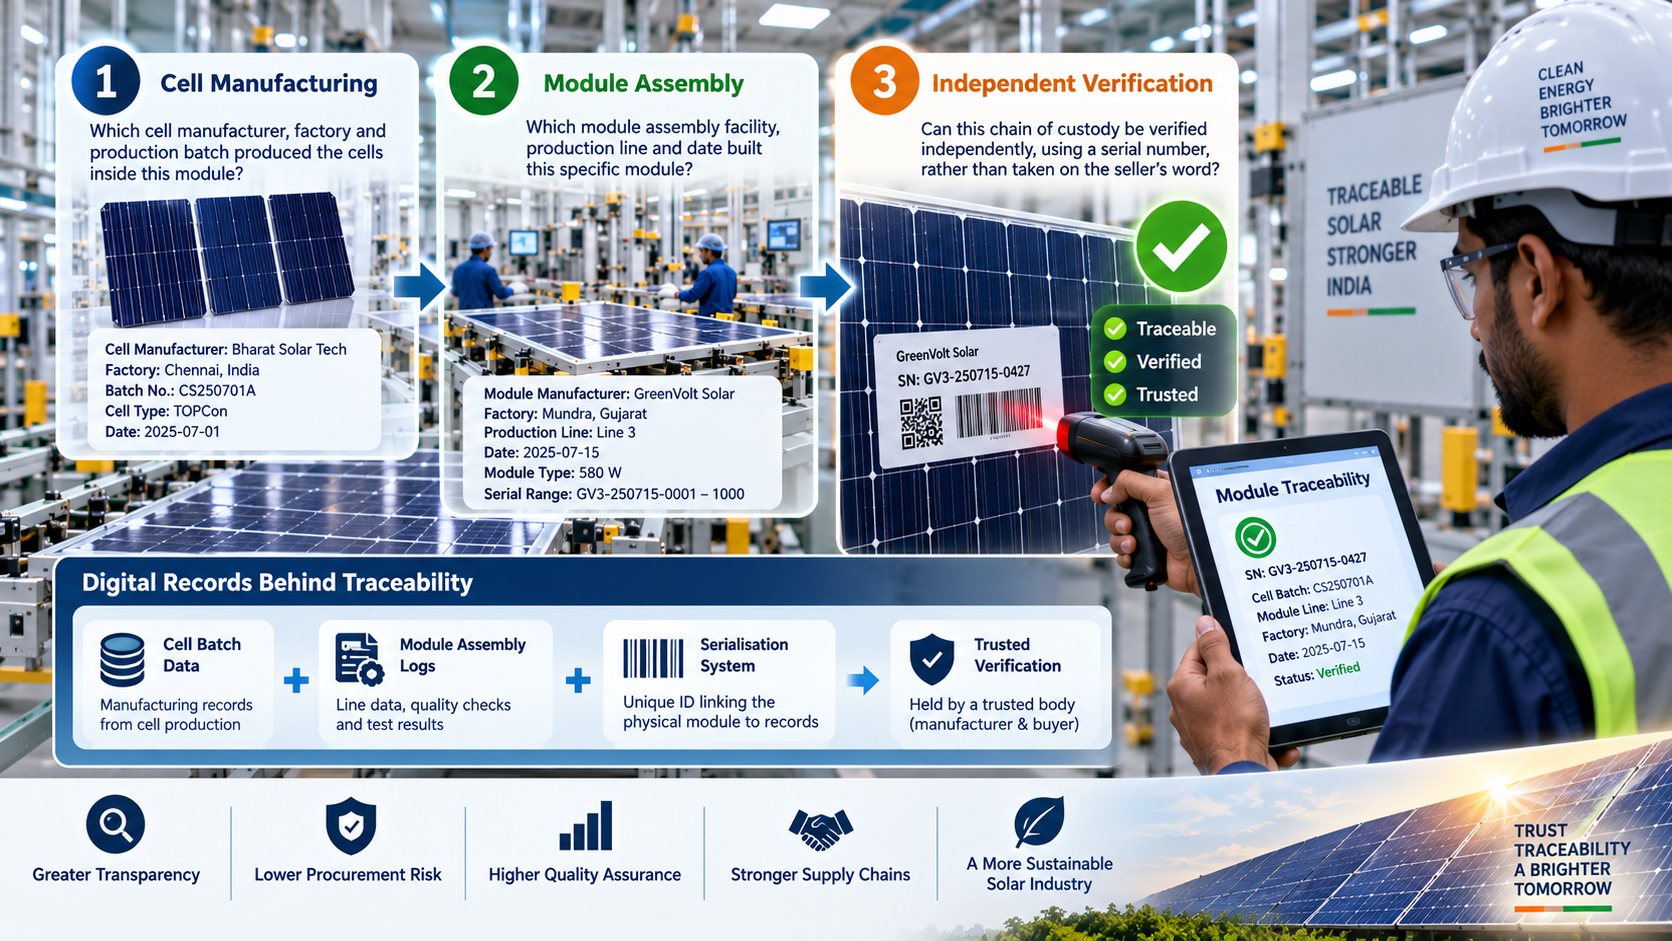
  5. Batch traceability system. Confirm the manufacturer can trace a specific delivered cell batch back to its production date, line, and raw material lot — this matters significantly if a quality issue surfaces post-installation and you need to determine whether it’s isolated or systemic.

Capacity & Commercial Risk

  1. Nameplate capacity vs. actual committed order book. A manufacturer’s stated GW capacity is meaningless if it’s already fully booked by other buyers — ask directly what uncommitted capacity exists for your delivery window.
  2. Raw material supply chain resilience. Given India’s current import dependence on wafers and cell inputs, ask how the manufacturer sources wafers and what contingency exists if their own upstream supply is disrupted.
  3. Production ramp track record. Ask for historical evidence of the manufacturer hitting stated capacity ramp timelines on past expansions — announced capacity and delivered capacity are frequently different numbers in this industry.
  4. Financial stability check. For long-term or high-volume contracts, request basic financial statements or credit information — a supplier’s inability to weather a raw material price spike (silver being a notable current risk factor) can directly threaten your delivery schedule.

Physical & Operational Verification

  1. Factory visit — production line observation, not just office tour. Where feasible, physically observe the diffusion, PECVD, screen-printing, and testing stages in operation, not just a conference room presentation.
  2. Equipment vintage and maintenance records. Older or poorly maintained production equipment often correlates directly with wider quality variance — ask about equipment age and maintenance/calibration schedules for critical process tools.
  3. Reference checks with existing customers. Speak directly with at least two to three existing customers of comparable order size — ask specifically about on-time delivery performance and post-delivery quality issues, not just general satisfaction.

Putting the Checklist to Work

Audit Category

Priority for New Suppliers

Priority for Renewal/Existing Suppliers

Regulatory compliance (#1–3)

Critical — verify before any commercial discussion

Re-verify annually; ALMM listings change

Manufacturing process (#4–8)

Critical — request before factory visit

Spot-check periodically, especially after any reported quality issue

Capacity & commercial (#9–12)

Critical for contracts over 12 months

Reassess at each renewal, particularly capacity commitments

Physical verification (#13–15)

Strongly recommended for orders above a material threshold

Recommended periodically, not just at initial qualification

A Note on Audit Timing

Given the current supply-constrained environment, there’s real pressure to fast-track supplier qualification. Resist compressing the audit itself — instead, compress the decision timeline by front-loading document requests (points 1–8 above) before scheduling a factory visit, so the visit itself becomes a verification step rather than a discovery step.

Websol Energy System publishes its cell datasheet and quality-process documentation directly for procurement review, and as a manufacturer with over three decades of solar cell production experience in India, maintains documented batch traceability and inline quality control across its M10 Bifacial Mono-PERC cell production. Review specifications on the Websol solar cell page, or reach out directly for supply documentation ahead of a factory audit.

Frequently Asked Questions

How long should a full supplier audit take?

For a first-time, high-volume supplier relationship, a thorough audit — document review, factory visit, and reference checks — typically takes several weeks. Compressing this meaningfully increases the risk of missing capacity or quality issues that only surface under sustained production volume.

Documentation review catches most compliance and process-control gaps, but a physical visit remains the most reliable way to verify equipment condition, actual (versus claimed) production line activity, and general operational discipline — particularly for contracts above a material order size.

Reluctance to provide batch-specific test data (EL scans, binning reports, PID/LID results) rather than generic technology-level specifications is one of the clearest warning signs — credible manufacturers with strong process control are typically willing to share this data.

Yes — ALMM List-II has gone through multiple revisions since its June 2026 implementation, and a supplier’s listing status should be re-confirmed for each significant order, not assumed to be permanent from initial qualification.

Price should be evaluated only after a supplier clears the compliance and process-control checks — a lower-priced cell from a supplier with weak batch consistency or unverified capacity commitments often carries higher total project risk than the price difference alone suggests.

The Cell-to-Module Efficiency Gap: Where Solar Power Is Lost After Cell Manufacturing

The Cell-to-Module Efficiency Gap: Where Solar Power Is Lost After Cell Manufacturing

Procurement teams routinely compare cell efficiency numbers when evaluating suppliers — 22.5% versus 23.1%, and so on. But a cell’s rated efficiency is measured before it’s anywhere near a finished module. Once that cell is encapsulated in glass, EVA, backsheet and frame, its contribution to the module’s actual output power shifts — sometimes down, occasionally up. Understanding why is essential to reading a module datasheet correctly.

Quick Answer

Cell-to-module (CTM) loss is the difference between the sum of a module’s individual cell power ratings and the module’s actual measured output power after assembly. In real manufacturing, CTM values typically range between 97% and 99% — meaning a well-designed module retains 97–99% of its cells’ combined rated power, while poor design choices can push that ratio lower. The gap is driven by optical, electrical, and geometric effects introduced during lamination and interconnection — and, notably, good module design can sometimes turn a “loss” into a net gain.

What CTM Actually Measures

The encapsulation of solar cells into a photovoltaic module introduces optical loss mechanisms, and typically the output power of the module is less than the total sum of individual cells — this difference is referred to as cell-to-module (CTM) losses.The additional electrical and optical effects introduced during the manufacturing of a module result in power loss — or, sometimes, gain — compared to the solar cells used to make it; the difference between input power and output power is the CTM conversion loss, which manufacturers work to minimise.

Put simply: if you buy cells individually rated at a combined 550W and the finished module tests at 535W, roughly 15W has gone somewhere during assembly — and CTM analysis is the discipline of identifying exactly where.

The Main Loss (and Gain) Mechanisms

Optical, geometrical and electrical effects interact and result in a cell-to-module ratio in terms of power and efficiency — analysis breaks these effects down to the material level to assess the potential for optimisation. A rigorous CTM analysis typically calculates around 15 distinct loss and gain factors based on material properties and module setup. Broadly, they fall into three categories:

Optical effects — reflection and absorption losses introduced by the front glass, the encapsulant (typically EVA or POE), and the anti-reflective coating. Some of these can actually be gains: anti-reflective coating on the cover glass can produce a power gain, alongside a power loss from junction box resistance — meaning module-level effects aren’t uniformly negative.

Electrical effects — resistive losses in the interconnection ribbons, solder joints, and junction box, plus current mismatch losses when cells with slightly different electrical characteristics (see our companion piece on solar cell binning and quality control) are wired together in a series string.

Geometric effects — the inactive space between cells, and the inactive margin around the module’s edge. Losses from the inactive module margin and the cell and string spacing areas are described by specific factors in CTM modelling that account for geometrical losses of inactive areas that don’t contribute to power generation. Every millimetre of gap between cells is silicon area not being used, and it directly drags down the module’s overall power-per-area.

CTM Loss Factors at a Glance

Loss/Gain Category

Typical Driver

Effect on CTM

Front glass reflection

Light reflected before reaching cell

Loss

Anti-reflective coating

Reduces surface reflection

Gain

Encapsulant absorption

Light absorbed in EVA/POE layer

Loss

Cell/string spacing

Inactive gaps between cells

Loss

Inactive module margin/frame area

Non-active border area

Loss

Interconnection resistance

Ribbon and solder joint resistance

Loss

Current mismatch

Cells with differing I-V curves wired together

Loss

Junction box resistance

Fixed electrical component loss

Loss

Half-cell / shingled design

Reduced resistive losses, tighter cell packing

Gain (can push CTM above 100%)

Why Half-Cell Design Can Push CTM Above 100%

This is the counterintuitive part that’s genuinely useful for procurement teams to understand: CTM isn’t a fixed ceiling that only ever subtracts from a module’s power. Comparisons of cell-to-module results show that while full-cell modules had CTM power ratios ranging between 93% and 97%, CTM power ratios over 100% were achieved for half-cell modules made from the same materials.

The reason is that cutting cells in half reduces the current flowing through each half-cell for the same voltage output, which cuts resistive losses in the interconnection ribbons roughly in proportion. Since resistive loss scales with the square of current, halving current per cell meaningfully reduces one of the largest electrical loss terms in the CTM equation — enough, in well-optimised designs, to offset the optical and geometric losses entirely and produce a module that outputs more than the simple sum of its individual cell ratings.

This is also part of why the industry’s shift toward half-cut and shingled cell architectures over the last several years wasn’t purely a wafer-size story — it was, in significant part, a CTM optimisation story.

Why This Matters for Procurement Decisions

Comparing cell efficiency alone misrepresents module performance. Two suppliers offering cells with identical rated efficiency can deliver meaningfully different finished module wattage depending on their module design and assembly quality — the CTM ratio, not just cell efficiency, determines what you actually receive.

CTM ratio is a proxy for manufacturing process discipline. A manufacturer consistently achieving high CTM ratios has tight control over lamination temperature/pressure, interconnection quality, and cell binning — all indicators of a mature, well-controlled production line rather than a loosely managed one.

Module design choices (half-cell, cell spacing, encapsulant type) are legitimate technical differentiators. When comparing module datasheets that look similar on cell technology and wafer format, ask specifically about module architecture — half-cell vs. full-cell, cell gap dimensions, encapsulant type — since these design choices materially affect the final CTM outcome.

Websol Energy System’s M10 Bifacial Mono-PERC solar cells are engineered for use in half-cell, multi-busbar module architectures — the design category most associated with favourable CTM outcomes in current industry data. Cell-level specifications are available on the Websol solar cell page, and our detailed look at solar cell conversion efficiency and project ROI covers how cell-level efficiency numbers should — and shouldn’t — be read by developers evaluating project returns.

Frequently Asked Questions

What is a "good" CTM ratio for a solar module?

Industry data suggests well-designed modules typically achieve CTM ratios between 97% and 99%, with the best half-cell and shingled designs occasionally exceeding 100%. Ratios meaningfully below this range may indicate suboptimal module design or manufacturing process control.

Yes, in specific cases — particularly with half-cell module architectures, where reduced resistive losses from lower per-cell current can offset optical and geometric losses enough to produce module output slightly higher than the simple sum of individual cell ratings.

No — CTM loss and gain factors depend heavily on module design choices (cell size, spacing, interconnection method) more than on the underlying cell technology itself, meaning CTM performance should be evaluated at the module design level, not assumed from the cell technology alone.

CTM ratio is calculated by comparing the sum of individually flash-tested cell power ratings against the module’s own flash-test output power after full assembly, typically measured under standard test conditions (STC).

It’s a reasonable diligence question for large-volume procurement, particularly when comparing modules with similar cell specifications — CTM performance data (or at minimum, module architecture details like cell gap and interconnection method) gives insight into manufacturing quality that cell efficiency alone doesn’t capture.

Solar Cell Quality Beyond Efficiency: EL Testing, Binning, PID, LID & Batch Consistency Explained

Solar Cell Quality Beyond Efficiency: EL Testing, Binning, PID, LID & Batch Consistency Explained

Two solar cells can carry the identical “22.8% efficiency” rating on their datasheet and perform very differently in the field five years later. Efficiency describes peak performance under standardised lab conditions on day one. It says nothing about manufacturing consistency, hidden microcracks, or how the cell will hold up under real-world voltage stress and UV exposure. That’s where a different set of quality metrics — EL testing, binning, PID resistance, and LID performance — actually determine long-term project economics.

Procurement teams that stop their diligence at the efficiency number are evaluating maybe a third of what actually matters.

Quick Answer

Solar cell quality is determined by more than headline efficiency: electroluminescence (EL) testing reveals invisible defects like microcracks and broken fingers, binning ensures cells with matched electrical characteristics are grouped together to avoid module-level mismatch losses, and PID (potential-induced degradation) and LID (light-induced degradation) testing predicts how much power a cell will lose over years of field operation. A manufacturer with strong batch-to-batch consistency across all four dimensions delivers more predictable long-term energy yield than one competing purely on peak efficiency numbers.

Electroluminescence (EL) Testing: Seeing What the Eye Can’t

Electroluminescence testing is a non-destructive diagnostic that injects forward-bias current into solar modules in darkness and captures near-infrared emission to reveal invisible cell defects — detecting microcracks, PID damage, broken cells, solder bond failures, and inactive cells. The underlying physics is the photovoltaic effect running in reverse: when electrical current passes through a solar cell in the forward direction, the cell emits infrared light through electroluminescence, and the intensity of this emission directly correlates with the local voltage across the cell, which in turn depends on the cell’s material quality and electrical properties.

By applying a forward bias current, the solar cells emit infrared light, which is captured by a sensitive camera to reveal defects such as microcracks, broken fingers, and shunting. During solar panel manufacturing, electroluminescence testing is integrated into production lines as a real-time quality assurance measure — meaning it’s not an optional add-on test but a standard checkpoint that reputable manufacturers run before a cell or module ever leaves the factory.

What EL Imaging Actually Catches

Defect Type

What It Looks Like on EL Scan

Field Consequence If Missed

Microcracks

Fine dark lines, often invisible to naked eye

Progressive power loss, potential hot-spot formation

Broken/damaged fingers

Localised dark patches disrupting current flow

Reduced local current collection, minor to moderate power loss

Soldering defects

Irregular dark zones at interconnection points

High-resistance joints, potential long-term reliability failure

PID darkening

Characteristic edge or cell-perimeter darkening

Progressive voltage-stress-driven power degradation

Inactive/dead cells

Fully dark cell area

Full cell contribution lost, mismatch loss across the string

EL imaging can reveal problems such as microcracks, dead zones, poor soldering, and potential-induced degradation that may affect the performance and durability of PV modules and systems — and because these are internal, sub-visual defects, a purely visual inspection line will miss all of them.

Cell Binning: Why Matching Matters As Much As Peak Performance

End-of-line characterization of solar cells is necessary to filter out defective cells and bin cells to avoid power mismatch loss in photovoltaic modules. Binning groups cells with closely matched current and voltage output together before they’re assembled into a module string.

The reason this matters: in a series-connected string, the weakest cell sets the ceiling for the whole string’s current output. A single underperforming cell mixed into an otherwise high-performing batch doesn’t just underperform on its own — it drags down every cell connected in series with it. Rigorous binning is what prevents this “worst cell tax” from eating into the output of an entire module, and by extension, an entire array.

Increasingly, this process itself is evolving. Current-voltage testers, used by almost any photovoltaic company, are costly to maintain and adapt to recent morphological changes in solar cells — larger and thinner wafers, half or shingled cells, and a wide range of busbar layouts — which is why some manufacturers are now exploring electroluminescence-image-based binning as a faster, more adaptable alternative to traditional I-V testing.

PID: The Slow Leak You Can’t See Coming

Potential Induced Degradation (PID) appears as dark spots at cell edges on EL scans and is one of the defect types with a direct impact on module efficiency, safety, and lifespan. PID is driven by voltage stress between the cell and the grounded module frame — over time, this stress causes ion migration within the cell that progressively degrades output, often invisibly, until measurable power loss shows up in performance monitoring, sometimes years into a project’s operational life.

Because PID is a slow, cumulative effect rather than an immediate failure, it’s exactly the kind of defect that’s easy to overlook during initial commissioning tests but expensive to discover during a 10-year performance warranty dispute. This is why PID-resistance testing at the manufacturing stage — not just at commissioning — matters for long-duration project economics.

LID: Degradation That Starts on Day One

Light-Induced Degradation is a related but distinct phenomenon — a small, largely front-loaded power loss that occurs in the first hours to weeks of a cell’s exposure to sunlight, driven by boron-oxygen defect complexes in the silicon (for boron-doped p-type cells specifically). Manufacturers manage LID through cell processing choices — including using gallium-doped rather than boron-doped wafers, or applying specific thermal treatments — and a cell’s LID performance is one of the manufacturing-process variables that separates a well-controlled production line from an inconsistent one.

Batch Consistency: The Metric Nobody Puts on a Datasheet

None of the individual tests above matter as much as consistency across production batches. A manufacturer that occasionally produces an exceptional cell but regularly ships batches with wide performance variance creates exactly the mismatch problem that binning is designed to solve — except at a project-wide scale instead of a single-module scale.

For EPCs and procurement teams, batch consistency is best evaluated by asking suppliers for actual batch-level test data — EL scan pass rates, binning distribution reports, PID test results per IEC 62804, and LID performance data — rather than relying solely on a single headline efficiency figure from a marketing datasheet.

What This Means for Solar Procurement

Request test documentation, not just a datasheet. A credible cell or module manufacturer should be able to provide EL scan records, binning class breakdowns, and PID/LID test reports for the specific batch being supplied — not just generic technology-level specifications.

Treat “same efficiency rating” as necessary but not sufficient. Two modules rated at the same efficiency percentage can have meaningfully different field reliability depending on binning discipline and defect rates during manufacturing.

Factor quality-testing rigor into long-term LCOE, not just upfront price. A cell with slightly lower headline efficiency but tighter batch consistency and stronger PID/LID performance can outperform a marginally higher-efficiency cell over a 25-year project lifetime.

Websol Energy System integrates in-line inspection and batch traceability into its M10 Bifacial Mono-PERC cell manufacturing process, alongside PERC-specific process controls for LID/LeTID performance. Full quality-process details are available on the Websol solar cell page, and buyers evaluating module-level quality documentation may also find our piece on IEC and BIS certification requirements a useful companion reference.

Frequently Asked Questions

What is the difference between EL testing and standard visual inspection?

Visual inspection catches only surface-level, visible defects. EL testing uses infrared imaging under forward bias current to reveal internal and sub-surface defects — microcracks, broken fingers, soldering issues — that are completely invisible to the naked eye.

Binning is the process of sorting manufactured cells into performance categories (based on current and voltage output) so that cells assembled into the same module or string have closely matched electrical characteristics, minimising mismatch losses.

Some PID cases can be partially reversed using specialised PID-recovery equipment applied at night, but this is a mitigation, not a permanent fix — the underlying degradation risk depends on the cell’s original PID resistance, which is set at the manufacturing stage.

LID is a known characteristic of certain silicon cell types (particularly boron-doped p-type cells) rather than a manufacturing error, but the magnitude of LID varies significantly based on wafer doping choice and cell processing — well-controlled manufacturing minimises it.

Request batch-specific EL scan data, binning distribution reports, and third-party PID/LID test certificates (per IEC 61215 and IEC 62804 standards) rather than relying on general marketing claims — and where possible, arrange a factory quality-process audit before finalising a large-volume order.

G12R Solar Cells Explained: Why Rectangular Wafers Are Changing Solar Module Design

G12R Solar Cells Explained: Why Rectangular Wafers Are Changing Solar Module Design

Wafer format debates in solar have historically come down to a binary choice: M10 or G12. G12R doesn’t pick a side — it’s a deliberate compromise, engineered specifically to solve a problem that pure G12 modules created: modules too wide for standard rooftop rails and mounting hardware.

If you’ve seen “G12R” on a module datasheet and assumed it was just G12 under a different name, it’s worth understanding what’s actually different, because it changes procurement, transport, and installation math.

Quick Answer

G12R is a rectangular variant of the 210mm G12 wafer, cut narrower on one axis to fit inside a module footprint close to standard M10 dimensions while keeping G12’s larger active cell area. The result is a module that delivers power output closer to a G12 module but with the handling, racking, and inverter compatibility of a more conventional-width panel — making it a practical middle ground for rooftop and distributed-generation projects where full-width G12 modules are too unwieldy.

What Makes a Wafer “R”

The G12R wafer combines the advantages of M10 and G12, arranging 96 half-cells instead of the 108 used in a standard configuration, while keeping the module width to almost the same 1,134mm as a conventional design. That width figure is the whole point of the format: when G12 wafers are used in a standard module design, module width increases to 1,303mm, which is suitable for ground-mounted installations but too unwieldy for rooftop systems.

G12R offers the optimal compromise — maximum performance without compromising compatibility and handling. In practical terms: G12R cells are cut from the same 210mm G12 ingot/wafer, but instead of using the full square wafer, manufacturers slice it into a rectangular shape — narrower in one dimension while retaining most of the larger wafer’s active area advantage over M10.

G12R vs. M10 vs. Full-Size G12 — Where It Sits

Attribute

M10 (182mm)

G12R (rectangular)

Full G12 (210mm)

Wafer origin

182mm ingot format

Cut from 210mm G12 ingot, rectangular

210mm ingot format, square

Typical module width

~1,134mm

~1,134mm (comparable to M10)

Up to ~1,303mm

Rooftop compatibility

Standard, widely compatible

Designed specifically for this

Often too wide for standard rails

Active cell area vs. M10

Baseline

Larger than M10

Largest

Cells per module (half-cell)

108 (typical)

96 (typical)

Varies, generally fewer, larger cells

Best-fit application

Rooftop, general-purpose

Rooftop and C&I seeking higher wattage per panel

Utility-scale, ground-mount

Figures reflect commonly cited module design parameters for these formats; exact specifications vary by manufacturer and should always be confirmed against the specific module datasheet.

Why the Industry Needed a Rectangular Format At All

The push toward larger wafers — from M2 through M6, M10, and finally G12 — has consistently traded higher power-per-cell for larger physical dimensions. That trade-off works cleanly for utility-scale ground-mount projects, where site layout can absorb wider, heavier modules. It works far less cleanly for commercial and residential rooftops, where rail spacing, roof geometry, and structural load limits are often fixed constraints that predate the module choice.

G12R exists specifically to decouple these two variables — power density and module footprint — that had become linked as the industry chased ever-larger wafers. By keeping the module width close to M10-class dimensions while retaining more of G12’s active silicon area, G12R lets a rooftop project capture some of the wattage benefit of the larger wafer generation without triggering a racking, inverter, or structural redesign.

Additional Efficiency Gains Beyond Cell Size

Wafer format is only part of the G12R story — manufacturers using the format have also paired it with complementary cell-edge technology. Some G12R module designs use edge passivation technology that reduces electrical losses at the cell edges, further increasing the efficiency of each module. This matters because cutting a square G12 wafer into a rectangular shape necessarily creates more edge area relative to active area than an uncut square cell — edge passivation is one way manufacturers offset that geometric trade-off.

What This Means for Procurement and Project Design

For EPCs specifying rooftop or C&I projects: G12R-based modules are worth evaluating specifically where you want higher per-panel wattage than M10 delivers, but where full-width G12 panels don’t fit existing rail systems, roof dimensions, or structural load assumptions. Always request the exact module width and weight from the datasheet — “G12R” alone doesn’t guarantee compatibility with every rail system; confirm against your specific racking vendor’s specifications.

For module manufacturers evaluating the format: G12R requires additional wafer-cutting steps compared to using G12 wafers as-is, which adds a process step (and potential yield loss point) versus standard M10 or full G12 lines. Manufacturing line compatibility should be assessed before committing tooling budget to the format.

For procurement teams comparing module quotes: Don’t compare G12R wattage directly against M10 wattage without normalising for module area — a higher-wattage G12R module in a similar footprint to M10 is genuinely a density improvement, but the comparison is only meaningful once you’ve confirmed both modules’ physical dimensions are actually comparable.

Websol Energy System currently manufactures M10 Bifacial Mono-PERC cells as its core production format — a well-established, widely rail-compatible choice for EPCs prioritising broad compatibility across mounting systems. For procurement teams weighing M10 against emerging rectangular and large-format alternatives, our solar cell product specifications are a useful comparison baseline, and our detailed comparison of M10 versus G12 wafer formats covers the underlying wafer economics in more depth.

Frequently Asked Questions

Is a G12R cell the same size as an M10 cell?

No. A G12R cell is cut from the larger 210mm G12 wafer and generally retains more active area than an M10 cell, even though the resulting module width is designed to be comparable to an M10-based module.

Full-size G12 modules are typically wider than standard rooftop rail systems are designed for — module widths can reach roughly 1,300mm, which creates handling, racking, and structural challenges on residential and many commercial roofs.

Not inherently, but current and voltage characteristics depend on the specific cell configuration (number of cells, half-cut vs. full-cut, series/parallel arrangement) — always verify string sizing and inverter compatibility against the specific module datasheet rather than assuming compatibility based on the wafer format name alone.

Cell conversion efficiency (percentage of sunlight converted to electricity) is determined primarily by cell technology — Mono-PERC, TOPCon, HJT — rather than wafer size or shape. G12R’s advantage is typically higher power per module in a comparable footprint, not necessarily higher percentage efficiency.

Availability varies by manufacturer and is evolving as the industry’s larger-format wafer transition continues. Buyers should confirm current production status, lead times, and ALMM List-II cell compliance directly with individual suppliers rather than assuming universal availability.

India’s Solar Cell Supply Crunch: Why Domestic Cell Availability Has Become a Procurement Risk

India's Solar Cell Supply Crunch: Why Domestic Cell Availability Has Become a Procurement Risk

Some solar module manufacturers in India are now quoting eight-month lead times for a component that used to arrive in weeks. The bottleneck isn’t glass, isn’t EVA film, isn’t aluminium frame — it’s the solar cell itself. And it’s a structural problem that procurement teams need to plan around for the next several years, not a temporary blip.

Quick Answer

India’s solar module manufacturing capacity has scaled to roughly 200 GW, but domestic solar cell manufacturing capacity sits at only around 30 GW — meaning nearly 80% of module assembly still depends on imported cells. With ALMM List-II for solar PV cells now requiring domestically made cells for most project categories, that five-to-six-times gap between module and cell capacity has turned into an active procurement constraint, with some manufacturers reporting cell wait times stretching to eight months and production cuts across a third of small and mid-sized panel makers.

The Scale of the Gap

Nameplate solar cell manufacturing capacity in India stands at roughly 30 GW, forming only about 20 percent of module manufacturing capacity — for the remaining 80 percent, module manufacturing has had to depend on imported cells, primarily from China. Module manufacturing capacity has outpaced cell manufacturing capacity by more than five times, creating high demand for new cell production.

The imbalance gets sharper when you look at specific technologies. Domestic solar cell capacity, at about 31 GW, is far below module manufacturing capacity of around 193 GW — and the mismatch is sharper in TOPCon, where approved module capacity is nearly 172 GW but domestic TOPCon cell capacity is only around 10 GW. A module manufacturer betting on N-type technology for its higher efficiency is, in practice, betting on the thinnest slice of an already-thin domestic supply.

Must read: DCR vs Non-DCR Solar Cells: Complete Guide for Indian Buyers, EPCs, and Developers (2026)


Why Value Addition Makes This Worse, Not Better

Nearly 60 percent of the solar module cost is attributable to the solar cell itself — so the component in shortest domestic supply also happens to be the one carrying the largest share of a module’s bill of materials. That combination is exactly what makes cell availability a pricing risk as much as a timeline risk: a supply-constrained input that dominates cost structure gives cell manufacturers unusual pricing leverage over standalone module assemblers.

What’s Actually Happening on the Ground

The numbers above were a forecast risk earlier in 2026. By mid-year, they had become an operational reality. India currently has around 200 GW of solar panel manufacturing capacity but only 27 GW of solar cell production capacity, with effective output estimated at just 16–18 GW — and industry sources report new rules restricting imported Chinese cells have left manufacturers waiting up to eight months for domestic supplies.

As a result, nearly one-third of India’s small and medium-sized solar panel makers have halted production, while others have significantly reduced operations. The All India Solar Module Manufacturers Association reported that nearly a third of the country’s 140 small- and medium-sized panel makers — representing 60% of manufacturing capacity — have halted output entirely, with the rest cutting operating cycles to three or four days a week.

One module maker described the practical impact bluntly: after suffering from cell unavailability for months, production was expected to shrink from 3.2 GW to about 1 GW. That’s not a rounding-error disruption — it’s a two-thirds capacity cut driven entirely by an upstream input shortage.

Why New Cell Capacity Can’t Simply Switch On

Industry voices have pushed back on the idea that new cell lines can be commissioned on short notice, noting it is genuinely difficult to start producing cells within 18 months given the complexity of the technology, the land requirements, and the sourcing of raw materials. Cell manufacturing is a fundamentally different capital and technical undertaking than module assembly — diffusion furnaces, PECVD lines, and screen printers require longer lead times, deeper process expertise, and larger upfront capital than a module assembly line, which is one reason India’s cell capacity has consistently trailed module capacity by a wide margin.

The Policy Response — And Its Limits

MNRE has offered partial relief rather than a blanket delay. The government granted net-metering and open-access solar projects an extension until December 31, 2026 to comply with the domestic-cell requirement, while maintaining a firm stance on the core policy and ruling out a blanket extension for all project categories. For a full breakdown of exactly which project categories qualify for this window, see our companion piece on ALMM List-II compliance requirements.

Manufacturers remain broadly optimistic about the medium term, with several new manufacturing facilities expected to become operational in phases through December 2026, which industry players expect will significantly strengthen domestic cell availability. But “several new facilities becoming operational” is a multi-quarter process — it does not resolve procurement risk for projects with near-term commissioning deadlines.

What This Means for Your Procurement Strategy

1. Cell-level supply is now a bigger scheduling risk than module-level supply. Traditional procurement risk assessments that focus on module lead times need to be rebuilt around cell availability specifically — ask suppliers directly about their cell source, not just their module brand.

2. Vertically integrated manufacturers carry materially lower supply risk right now. A manufacturer producing its own cells in-house isn’t exposed to the eight-month wait times being reported industry-wide for third-party cell supply. Websol Energy System Limited manufactures its own M10 Bifacial Mono-PERC cells rather than sourcing them externally — worth a specific question to ask any module supplier during vendor qualification: do they make their own cells, or are they waiting in the same queue as everyone else?

3. Lock in supply commitments earlier than you’re used to. With a sharp gap between India’s ~193 GW of module capacity and just ~31 GW of cell capacity, especially in TOPCon technology, cell capacity that exists today will get contracted quickly. Waiting until a tender is won to start cell sourcing conversations is now a material timeline risk.

4. Technology choice affects supply risk. Given the sharper TOPCon-specific gap, projects specified for TOPCon modules should budget more schedule contingency than Mono-PERC-specified projects, where domestic capacity is comparatively more mature.

Frequently Asked Questions

Why does India have so much module capacity but so little cell capacity?

Module assembly requires lower capital investment and shorter commissioning timelines than cell manufacturing, so India’s earlier manufacturing incentives (and ALMM List-I) drove rapid module capacity growth first. Cell manufacturing — involving diffusion, PECVD, and screen-printing lines — is more capital- and technology-intensive, and has taken longer to scale.

Estimates vary; some industry sources expect it could take three to five years for domestic cell capacity to meaningfully close the gap with module capacity, given the time required to build and commission new cell manufacturing lines.

No — the gap is proportionally worse for advanced N-type technologies like TOPCon, where domestic cell capacity is a much smaller share of approved module capacity compared to conventional Mono-PERC.

Only for project categories that remain outside ALMM List-II’s mandatory scope, or during applicable exemption windows. For List-II-applicable projects, imported cells are not compliant regardless of availability.

Yes — since cells represent roughly 60% of module cost and are the constrained input, tightening cell supply typically pushes cell (and therefore module) pricing upward, independent of raw material costs like polysilicon or silver.

ALMM List-II for Solar PV Cells in India: What EPCs, Installers & Module Manufacturers Need to Know in 2026

ALMM List-II for Solar PV Cells in India: What EPCs, Installers & Module Manufacturers Need to Know in 2026

For seven years, “ALMM” meant one thing to Indian solar procurement teams: an approved list of module brands. From June 1, 2026, that changed. A second list now governs what goes inside the module — the solar cell itself — and it has already reshaped bidding, sourcing, and project timelines across the industry.

If your project documentation still treats ALMM as a module-only checklist, it’s out of date. Here’s what actually changed, who it applies to, and how to build a compliant procurement plan around it.

Quick Answer

ALMM List-II is the Ministry of New and Renewable Energy’s (MNRE) approved list of domestic solar cell manufacturers and models. Effective from June 1, 2026, most government-backed, net-metered, and open-access solar projects in India must use modules built with cells sourced from ALMM List-II-listed manufacturers — not just ALMM List-I-listed module brands. Net-metering and open-access projects received a partial relief window, with commissioning allowed without List-II cells until December 31, 2026, but this is not a blanket extension and should not be treated as a scheduling shortcut.

What Is ALMM List-II, Exactly?

The original ALMM Order of January 2019 always envisioned two lists: List-I for solar PV modules, and List-II for solar PV cells. List-I of solar PV modules has been in force since 2019, but List-II for solar PV cells had never actually been notified until MNRE moved to activate it. MNRE’s December 2024 notification proposed List-II take effect from June 1, 2026, citing the country’s rapidly expanding solar PV cell manufacturing capacity as the trigger for finally activating it.

The measure officially came into force from June 1, 2026, requiring net-metering and open-access renewable energy projects commissioned on or after that date to use solar PV modules from ALMM List-I built with cells from ALMM List-II. Since then, MNRE has issued multiple revisions to List-II as new domestic cell capacity gets certified — the list is a living document, not a one-time notification, and procurement teams need to check it against each specific order, not against a memory of what was approved six months ago.

Who Actually Has To Comply

Project Category

ALMM List-II Applicability (as of August 2026)

Government-tendered / PSU solar projects

Mandatory from June 1, 2026

Net-metering rooftop projects

Exempted until Dec 31, 2026 (relief window)

Open-access RE power projects

Exempted until Dec 31, 2026 (relief window)

Projects commissioned before June 1, 2026

Exempted regardless of category

C&I / private PPA projects outside above categories

Case-by-case — check latest MNRE clarifications

MNRE’s July 2026 decision extended a limited ALMM List-II exemption for net-metering and open-access renewable projects through December 31, 2026, allowing these categories to commission without List-II-compliant cells during the window — but this is explicitly described as a transition measure, not a rollback of the underlying policy. From January 1, 2027, buyers should plan on the assumption that List-II compliance will apply to these categories unless MNRE issues a further controlling order.

Why MNRE Activated List-II Now

The introduction of ALMM List-II compliance was made mandatory from 1 June 2026 under an MNRE office memorandum dated December 9, 2024, with the stated goal of protecting India’s growing domestic cell manufacturing base from being bypassed by module makers who import cells. Without a cell-level list, a manufacturer could technically be “ALMM List-I certified” as a module brand while assembling entirely on imported cells — defeating the purpose of domestic manufacturing incentives.

MNRE has also signalled where this is headed next: a September 2025 draft proposed expanding ALMM to include wafers under a new List-III, with compliance requirements proposed to commence from June 1, 2028. EPCs building long-term supplier relationships should treat wafer traceability as the next compliance frontier, not a distant hypothetical.

What This Means for EPCs and Installers

  1. Module procurement documentation now needs two layers of proof, not one. A List-I certificate for the module brand is no longer sufficient evidence of compliance on applicable projects — you need documentation showing the cells inside that specific module batch trace back to a List-II-listed cell manufacturer and model.
  2. Bid timelines need a compliance buffer. MNRE’s recent clarifications were specifically aimed at eliminating the ambiguity that had been causing confusion during procurement and bidding stages — but ambiguity during a transition period is exactly when EPCs get caught with non-compliant inventory. Build in verification time before finalising a supplier.
  3. Exemption windows apply to commissioning date, not order date. If a net-metering or open-access project slips past December 31, 2026, it needs List-II-compliant cells regardless of when the modules were ordered. Padding project schedules with contingency time is now a compliance decision, not just a scheduling one.
  4. Government and PSU tenders assume full compliance already. There is no relief window for these categories — verify supplier List-II status before bid submission, not after award.

What This Means for Module Manufacturers

The policy has exposed a structural problem that module-only manufacturers can’t procurement their way around: India’s cell manufacturing capacity has not scaled at the same pace as module assembly capacity. That gap — and what it means for your supply chain risk specifically — is significant enough that we’ve covered it in detail in a dedicated piece on India’s solar cell supply crunch.

For manufacturers without in-house cell production, the practical choices are: (a) lock in long-term supply contracts with List-II-listed cell manufacturers now, before capacity gets fully booked, (b) evaluate backward integration, or (c) accept longer lead times as the new normal for compliant projects.

Websol Energy System Limited manufactures its own M10 Bifacial Mono-PERC solar cells at its West Bengal facility rather than depending on third-party cell supply — a structural position that removes one layer of ALMM List-II exposure for buyers sourcing Websol modules for List-II-applicable projects. You can review current cell specifications on the Websol’s solar cell page.

Verifying List-II Status: A Practical Checklist

  • Cross-check the manufacturer name and specific model/capacity against the current MNRE ALMM List-II PDF (not a supplier’s self-declaration)
  • Confirm the revision date of the list you’re checking — List-II has already gone through multiple revisions in 2026
  • Ask suppliers for cell-batch traceability documentation, not just a company-level listing
  • Reconfirm List-II status at PO stage, not just at RFQ stage — listings can be added or revised between quote and order
  • For net-metering/open-access projects, get the exact commissioning date in writing and stress-test it against the December 31, 2026 exemption boundary

Frequently Asked Questions

Q1. Is ALMM List-II the same as ALMM List-I?

No. List-I covers approved solar PV module brands and models; List-II separately covers approved domestic solar PV cell manufacturers. While ALMM List-I covers approved solar module makers, List-II covers approved solar cell manufacturers — a module can be List-I certified while still needing to prove its cells are List-II certified.

Net-metering rooftop projects fall under the relief window and are exempt from List-II compliance if commissioned before December 31, 2026. After that, compliance is expected to apply unless MNRE issues further clarification.

Non-compliant projects risk losing eligibility for the subsidy, tariff, or connection approval tied to ALMM compliance, and in some cases modules risk delisting consequences for the manufacturer. Exact consequences depend on project category and the specific tender or scheme conditions.

MNRE has issued multiple revisions through 2026 — the list documented an 8th revision dated 22.07.2026 following earlier revisions in February, April and earlier in the year — meaning procurement teams should treat it as a live document requiring a fresh check for every major order, not a one-time reference.

Yes — the current and all revised versions of ALMM List-II are published directly on the MNRE website under the ALMM order page, and this should be the authoritative source rather than a supplier’s marketing material or a third-party summary.

What Is Solar Cell Conversion Efficiency and How Does It Impact Your Project ROI?

What Is Solar Cell Conversion Efficiency and How Does It Impact Your Project ROI?

When solar developers, procurement officers, and EPC contractors compare modules, one specification appears in every conversation: efficiency. Yet efficiency is widely misunderstood, frequently overstated in marketing, and sometimes used to justify expensive technology choices that don’t improve project economics.

This guide explains exactly what solar cell conversion efficiency means, how it is measured, what drives it, and — most importantly — how it translates into real-world project ROI for solar installations in India.

What Is Conversion Efficiency?

Solar cell conversion efficiency is the percentage of incident solar energy (sunlight) that a solar cell converts into usable electrical energy under Standard Test Conditions (STC).

STC is defined as:

  • Irradiance: 1,000 W/m² (equivalent to a clear midday sun)
  • Cell temperature: 25°C
  • Air mass: AM1.5 spectrum

So if a solar cell with an area of 182 × 182mm (0.033 m²) receives 33 watts of sunlight and produces 7.3 watts of electricity, its efficiency is 7.3 / 33 = 22.2%.

Modern Mono PERC cells like those manufactured by Websol achieve efficiencies of 22–23%. The theoretical maximum efficiency for a single-junction silicon solar cell (the Shockley-Queisser limit) is approximately 29.4% — meaning there is still meaningful headroom, and why the industry continues investing in technology improvements.

How Is Efficiency Measured?

Every finished solar cell passes through a flash tester — a precision instrument that fires a calibrated pulse of light at the cell and measures the resulting current-voltage (I-V) curve. From this curve, three key parameters are extracted:

  • Voc (Open-circuit voltage): The maximum voltage across the cell when no current flows
  • Isc (Short-circuit current): The maximum current when voltage is zero
  • Fill Factor (FF): A measure of the “squareness” of the I-V curve; higher FF means better power extraction

Efficiency = (Voc × Isc × FF) / (Irradiance × Cell Area)

At the module level, efficiency is slightly lower than at the cell level due to inactive areas (frame, busbars, interconnections, and gaps between cells). A cell with 22.5% efficiency typically yields a module with 20.5–21.5% efficiency.

This cell-to-module efficiency gap is where manufacturing quality matters. Poor tabbing, misaligned strings, or substandard EVA encapsulation all reduce module-level efficiency below what the cells are capable of.

Why Higher Efficiency Matters for Indian Projects

1. Land Use

Higher efficiency means more power from the same physical area. For a 10 MW project:

  • 20% efficient modules require approximately 5.5 hectares of module area
  • 22% efficient modules require approximately 5.0 hectares

That half-hectare difference may seem modest, but in land-constrained states like Kerala, Karnataka hill districts, or Tamil Nadu where land acquisition costs are high, a 10% reduction in required land area meaningfully improves project economics.

2. Balance of System (BOS) Costs

Fewer modules per megawatt means fewer:

  • DC cables and conduits
  • String inverter inputs
  • Module mounting rails and clamps
  • Labour hours for installation

Across a 50 MW project, higher efficiency modules can reduce BOS costs by ₹0.5–1.5 crore — a meaningful saving that partly offsets any premium on high-efficiency modules.

3. Energy Yield vs. Nameplate Capacity

This is the critical point: efficiency at STC tells you about potential, but real-world yield depends on many other factors.

Indian project sites are not 25°C. They are not always 1000 W/m². They experience cloud cover, dust accumulation, angle-of-incidence losses, and thermal losses.

The key metrics for real-world Indian projects are:

  • Performance Ratio (PR): Actual generation divided by theoretical generation at nameplate capacity. A good Indian utility project targets PR above 80%.
  • CUF (Capacity Utilisation Factor): Annual generation divided by maximum theoretical generation. Indian utility solar typically achieves CUF of 18–23%.
  • Specific yield (kWh/kWp): Annual energy generated per kilowatt-peak of installed capacity.

Two modules with the same STC efficiency can deliver meaningfully different specific yields in the same location — depending on their temperature coefficient, bifaciality, low-light response, and degradation curve.

What Drives Efficiency Differences Between Cells?

Silicon Purity

Higher purity silicon has fewer defects in its crystal lattice — meaning fewer recombination sites where electrons and holes can recombine before generating current. This is why solar-grade polysilicon from established producers outperforms recycled or lower-purity material.

Cell Architecture

The move from standard BSF cells to Mono PERC raised practical cell efficiencies from 18–19% to 22–23% by adding rear surface passivation. The further move to TOPCon adds another 1–1.5% absolute efficiency through better passivation contact design.

Anti-Reflection Coating Quality

A well-deposited silicon nitride coating reduces front-surface reflectance from ~30% to below 2%. Variations in film thickness or uniformity — caused by process control issues — can cost 0.2–0.5% absolute efficiency.

Metal Contact Optimisation

The silver fingers on the front surface of a solar cell are a necessary trade-off: they collect current but also shade the underlying silicon. Multi-Busbar (MBB) designs use thinner, more numerous fingers to reduce this shading while maintaining low series resistance. MBB is now standard in quality cell production, including at Websol’s Falta SEZ facility.

Bifacial Design

Bifacial cells add rear-side light capture — typically 5–25% additional yield under real-world conditions. While this is not reflected in the front-side STC efficiency number, it substantially increases real-world energy output. This is why comparing module efficiency without considering bifaciality is incomplete for project planning.

The Efficiency-Cost Trade-off in Indian Solar

India’s solar market is price-sensitive. The levelised tariff in many government tenders — SECI, NTPC, state DISCOMs — forces developers to minimise CAPEX while hitting generation targets.

In this environment, chasing the highest-efficiency module (which carries a price premium) does not always improve project economics. The correct analysis is:

LCOE (Levelised Cost of Energy) = Total Lifetime Cost / Total Lifetime Energy

A high-efficiency TOPCon module at ₹26/Wp that generates 5% more energy over 25 years may or may not have a lower LCOE than a Mono PERC module at ₹22/Wp — depending on financing cost, land cost, O&M structure, and degradation assumptions.

This is why project-specific modelling — not headline efficiency comparisons — should drive technology selection.

Websol’s solar cells and modules are designed for the Indian market’s requirements: maximising actual energy yield per rupee of installed cost, with the quality and compliance credentials that Indian project finance demands.

Certification and Efficiency Claims: What to Verify

Not all efficiency claims are equal. Before accepting a datasheet figure, verify:

  • IEC 61215: Standard for module design qualification and type approval. Essential.
  • IEC 61730: Safety qualification. Essential.
  • BIS certification: Required for all modules sold in India under Bureau of Indian Standards norms.
  • PVEL/DNV reliability scorecards: Third-party durability and reliability testing. Top-performing modules are listed in annual scorecards — check if your supplier features.
  • ALMM listing: Required for government-funded projects. Confirms manufacturing location and quality compliance.

For DCR-compliant projects, verifying that the module manufacturer’s cells are MNRE-approved is equally important.

Frequently Asked Questions

Q1. What efficiency should I look for when buying solar modules for a commercial project in India?

For commercial projects, aim for modules with front-side efficiency of 20.5% or above (module level). For utility-scale, high-wattage modules — see our guide on 525–660 Wp modules — are increasingly standard.

Yes. All solar modules degrade over time. Quality PERC modules typically show 1.5–2% first-year degradation and 0.4–0.5% per year thereafter, retaining 82–85% of rated output after 25 years. TOPCon modules have lower degradation rates.

No. The theoretical maximum for single-junction silicon is ~29.4%. Multi-junction concentrator cells in laboratory settings exceed 40%, but these are not commercially viable for standard solar installations. Practical commercial modules top out around 23–24% in 2026.

Dust accumulation on modules — particularly in dry, arid zones like Rajasthan — can reduce output by 5–25% between cleaning cycles. This is why O&M planning (cleaning frequency, robotic vs. manual cleaning) is as important as module efficiency for annual energy yield calculations.

Yes. All silicon solar cells lose efficiency as temperature rises — typically 0.3–0.4% per degree Celsius above 25°C. In Indian summer conditions (cell temperatures reaching 65–75°C), modules may operate at 85–90% of their nameplate output during peak afternoon hours.

Detailed technical datasheets for Websol’s M10 Bifacial Mono-PERC solar cells are available on the solar cell product page. For project-specific technical discussions, contact Websol’s technical team.

Websol’s Backward Integration Strategy: From Solar Cells to the Full Value Chain

Websol's Backward Integration Strategy: From Solar Cells to the Full Value Chain

India’s solar manufacturing sector is undergoing a quiet but decisive transformation — and Websol Energy System Limited is at the heart of it. While the company built its reputation as a reliable solar cell and module manufacturer at Falta SEZ, West Bengal, the next chapter is far more ambitious: moving upstream to manufacture PV ingots and wafers, upgrading to next-generation TOPCon technology, and building a fully integrated supply chain that reduces India’s chronic dependence on Chinese imports. This is Websol’s backward integration strategy — and it has serious policy tailwinds behind it.

What Is Backward Integration in Solar Manufacturing?

Backward integration means a company expands into the earlier stages of its own supply chain. For a solar cell and module maker like Websol, this means moving “upstream” toward raw materials — specifically into silicon ingots and wafers, which are the foundational inputs for every solar cell.

Today, India imports nearly 100% of its solar wafer requirements, almost entirely from China. This creates significant exposure to price volatility, currency risk, and geopolitical supply disruptions. Backward integration addresses this vulnerability at its root.

The solar manufacturing value chain, from upstream to downstream, runs as follows:

Polysilicon → Ingots → Wafers → Solar Cells → Solar Modules

Websol currently manufactures at the cell and module stage. Its backward integration strategy targets the ingot and wafer segments — bringing the company closer to full vertical integration.

Websol’s Current Manufacturing Base

Before understanding the strategy, it’s important to see where Websol stands today.

Operating from its Falta SEZ facility in West Bengal, Websol commissioned its second cell line in September 2025, taking total cell manufacturing capacity from 600 MW to approximately 1.2 GW. Module manufacturing capacity stands at 550 MW. The company’s entire capacity is ALMM List-I and List-II compliant and qualifies under Domestic Content Requirements (DCR), making it eligible for key government schemes including PM Surya Ghar Yojana, CPSU Phase-II, and PM-KUSUM.

FY26 was a landmark year by any measure: revenue grew 82% year-on-year to ₹1,049 crore, EBITDA reached ₹429 crore at a margin of 41%, and Profit After Tax soared 96% to ₹303 crore — all funded through internal accruals, without dilutive equity raises.

This strong financial position is what is now enabling Websol to fund its backward integration roadmap.

The MoU with Linton Crystal Technologies: The Upstream Pivot Begins

In December 2025, Websol signed a Memorandum of Understanding with Linton Crystal Technologies, headquartered in Rochester, New York — a global leader in the design and manufacturing of Czochralski (CZ) furnaces and process control systems used in high-quality crystal growth for the photovoltaic industry.

Under this MoU, both parties agreed to explore the opportunity of manufacturing PV ingots and wafers in India. Websol intends to acquire PV ingot and wafer manufacturing equipment from Linton, which will also provide technical expertise, training, and skills development for Websol’s team to ensure optimised operations.

The collaboration is currently in the technical evaluation and R&D phase. Timelines and project details are being finalised in collaboration with Linton, with commercial-scale ingot and wafer production tentatively targeted around June 2028 — which, notably, aligns exactly with India’s ALMM List-III deadline.

Why June 2028 Matters: ALMM List-III and the Wafer Mandate

India’s Ministry of New and Renewable Energy (MNRE) expanded the ALMM framework in March 2026 to include solar ingots and wafers under a new ALMM List-III, effective June 1, 2028.

Under the revised framework:

  • Solar modules must come from ALMM List-I manufacturers
  • Solar cells must come from ALMM List-II manufacturers
  • Solar wafers must come from ALMM List-III manufacturers

For any project bid submitted after the cut-off date (seven days post the first List-III publication), ALMM List-III compliance will be mandatory. Non-compliant manufacturers risk delisting from ALMM List-I — effectively disqualifying them from supplying to all government-backed solar projects.

There’s an important prerequisite: MNRE will only publish ALMM List-III once at least three independent wafer manufacturers are operational in India with a combined capacity of 15 GW per annum. Each manufacturer must also hold equivalent ingot manufacturing capacity — meaning only truly integrated producers will qualify.

For Websol, the ALMM List-III deadline is not a threat — it is a strategic opportunity. If Websol successfully establishes domestic ingot and wafer manufacturing before 2028, it could position itself as one of the first ALMM List-III eligible producers in India, creating a powerful competitive moat over companies that remain import-dependent.

The Andhra Pradesh Greenfield Project: A 4 GW Integrated Facility

Alongside the upstream push, Websol received Government of Andhra Pradesh approval in January 2026 for a greenfield 4 GW integrated solar cell and module manufacturing facility at MPSEZ, Naidupeta, Tirupati district — approved through the Andhra Pradesh Economic Development Board (APEDB) with a customised incentive package including land allotment, capital investment subsidies, and duty exemptions.

The project will be developed in two phases:

  • Phase 1: 2 GW integrated TOPCon cell and module capacity, targeted by June 2027
  • Phase 2: Additional 2 GW, targeted by June 2028

Total capex for the 4 GW facility is estimated at over ₹3,000 crore. The project also includes a 100 MW captive solar power plant to ensure stable, low-cost renewable energy supply for manufacturing operations — reducing grid dependency and improving long-term cost competitiveness.

Importantly, the Andhra Pradesh facility will use TOPCon technology, targeting cell efficiencies of over 25% — a significant step up from the current Mono PERC platform.

TOPCon Technology Upgrade at Falta SEZ

Websol isn’t waiting for the Andhra Pradesh facility to begin the technology transition. At its existing Falta SEZ plant, the company is upgrading one of its Mono PERC cell lines to TOPCon (Tunnel Oxide Passivated Contact) technology.

The upgrade, estimated to cost ₹250–270 crore and funded through internal accruals, will increase total cell capacity at Falta to approximately 1.35 GW, including an incremental 150 MW from the efficiency-driven yield improvement. Commercial production from the upgraded TOPCon line is targeted to begin by February 2027, with a two-month ramp-up thereafter. The target cell efficiency is more than 24.5%.

TOPCon enables manufacturers to produce higher-wattage modules from the same wafer area, improving LCOE (Levelised Cost of Energy) for project developers and making Websol’s products more competitive against global benchmarks, including Chinese imports.

How Backward Integration Strengthens Websol’s Competitive Position

Websol’s backward integration strategy serves multiple strategic objectives simultaneously:

Supply Chain Security: By manufacturing ingots and wafers domestically, Websol eliminates its dependence on imported upstream inputs, reducing vulnerability to trade disruptions, exchange rate volatility, and Chinese supply cycles.

Margin Expansion: Wafer and ingot manufacturing carry significant value-add margins. Capturing these upstream stages means more of the module’s selling price stays within Websol’s own operations.

ALMM List-III Readiness: As explained above, companies that qualify for ALMM List-III will have a structural advantage in government-tendered projects post-2028 — which represent the bulk of India’s solar deployment pipeline.

Technology Differentiation: The combination of TOPCon cells and integrated upstream inputs positions Websol to offer high-efficiency, fully DCR-compliant modules at scale — a combination few Indian manufacturers can match today.

Policy Alignment: India’s PLI (Production Linked Incentive) scheme, PM Surya Ghar Yojana, and ALMM frameworks all reward integrated domestic manufacturers. Websol’s backward integration directly aligns with the direction of national policy.

The Road Ahead

Websol’s management has been clear that the next phase of growth will be driven not just by scale, but by deeper supply chain control and technology advancement. With a ₹1,161 crore order book as of FY26-end, a debt-free balance sheet post IREDA repayment, and strong internal cash generation, the company has the financial foundation to execute its integration roadmap without excessive leverage.

Key milestones to track:

  • February 2027: TOPCon commercial production begins at Falta
  • June 2027: Phase 1 of Andhra Pradesh 2 GW integrated facility commissioned
  • June 2028: Phase 2 of Andhra Pradesh facility + target date for ingot/wafer production readiness aligned with ALMM List-III

From a 600 MW single-technology cell manufacturer to a multi-GW, vertically integrated, TOPCon-capable solar company — Websol’s backward integration strategy represents one of the most consequential transformations underway in Indian solar manufacturing.

For procurement teams, EPC contractors, and project developers evaluating long-term module supply partners, Websol’s upstream integration journey means exactly one thing: greater supply assurance, stronger compliance credentials, and a manufacturer positioned to stay ALMM-relevant well into the next decade.

Solar Module Quality Certifications Explained: IEC, BIS, and What Indian Buyers Must Verify

Solar Module Quality Certifications Explained: IEC, BIS, and What Indian Buyers Must Verify

A solar module is a 25-year investment. When you install a module on a rooftop or in a solar park today, you are making a commitment to a product that must perform reliably through monsoons, dust storms, temperature extremes, and grid voltage fluctuations for a quarter of a century.

The difference between a module that delivers on that commitment and one that fails in year 7 often comes down to certification. Knowing which certifications matter — and what each one actually tests — is essential knowledge for every Indian EPC, developer, and procurement professional.

Why Certifications Matter (and What They Don’t Guarantee)

Solar module certifications serve two functions:

Baseline quality gating: They establish that a module has passed a defined set of tests under controlled laboratory conditions. A certified module has demonstrated, at a minimum, that it meets international safety and performance standards.

Bankability and compliance: Most project finance lenders, insurance providers, and government procurement programmes require certified modules. Certifications are the language that bridges manufacturers and institutional buyers.

What certifications do not guarantee:

  • That every module leaving the production line matches the certified design (manufacturing consistency is ensured by quality management systems, not certification)
  • Long-term field performance beyond what the accelerated ageing tests simulate
  • That the module was manufactured sustainably or ethically

The combination of relevant certifications, reputable manufacturer track record, and third-party reliability testing data (such as PVEL module scorecards) gives the most complete picture.

IEC 61215: The Core Design Qualification Standard

IEC 61215 is the most important solar module certification. It is the international standard for design qualification and type approval of crystalline silicon terrestrial photovoltaic (PV) modules — which includes all Mono PERC and TOPCon modules.

The IEC 61215 test sequence includes:

Performance testing:

  • STC (Standard Test Conditions) measurement
  • Low irradiance performance at 200 W/m²
  • Temperature coefficients
  • NOCT (Normal Operating Cell Temperature) measurement

Durability and stress testing:

  • Thermal cycling: 200 cycles between −40°C and +85°C — simulating decades of day/night temperature swings
  • Damp heat: 1,000 hours at 85°C and 85% relative humidity — simulating prolonged humid exposure (critical for Indian coastal and high-rainfall locations)
  • Humidity freeze: Exposure to high humidity followed by freezing — relevant for high-altitude Indian installations (Himachal, Uttarakhand)
  • Mechanical load: Simulates wind and snow pressure on the module surface
  • Hail impact: Steel ball impact test at specified speed and angle
  • UV pre-conditioning: Simulates UV-induced degradation of encapsulant

A module that passes IEC 61215 has demonstrated structural integrity and performance stability under these defined stress conditions. It does not mean the module has been tested for 25 years — the tests are accelerated simulations, not real-time ageing.

IEC 61730: Safety Qualification

IEC 61730 covers the safety qualification of PV modules — separate from the performance/durability testing in IEC 61215.

IEC 61730 tests include:

  • Electrical isolation and ground continuity
  • Fire resistance classification
  • Mechanical robustness
  • Protection against electrical shock
  • Reverse current overload capability

For Indian installations, IEC 61730 compliance is particularly relevant in:

  • Rooftop installations on occupied buildings (fire safety)
  • High-voltage utility-scale systems (electrical safety)
  • Any installation requiring compliance with National Electrical Code India (NEC) provisions

IEC 61730 certification is now effectively required alongside IEC 61215 for all serious commercial module sourcing in India.

BIS Certification: The India-Specific Requirement

BIS (Bureau of Indian Standards) certification under IS 14286 is a mandatory requirement for all solar modules sold in India under the Electricity Act and related regulations.

IS 14286 is India’s national standard for crystalline silicon terrestrial PV modules — harmonised with IEC 61215 but administered domestically by BIS. BIS certification requires:

  • Factory inspection by BIS-authorised agencies
  • Ongoing product testing through a licensed BIS testing laboratory
  • Annual licence renewal, with renewal subject to compliance verification

The critical implication: BIS certification lapses if a manufacturer fails to renew their licence. When a BIS certificate lapses, the ALMM listing of the associated modules is suspended. This is the mechanism that can cause mid-project compliance disruption if you’ve sourced from a manufacturer with BIS renewal risk.

Before finalising any module procurement, verify:

  1. The BIS licence number on the module’s datasheet
  2. The licence expiry date on the BIS portal (bis.gov.in)
  3. That the specific module model is covered by the licence (a manufacturer’s BIS covers specific models, not their entire catalogue)

MCS/PV Evolution Testing: Beyond Basic Certification

IEC 61215 defines a minimum test sequence. More rigorous testing programmes — particularly the PVEL (PV Evolution Labs) Product Scorecard — subject modules to extended stress sequences that go beyond IEC minimums.

PVEL’s extended tests include:

  • Extended thermal cycling: 600 cycles (3× the IEC standard)
  • Extended damp heat: 2,000 hours (2× the IEC standard)
  • PID (Potential Induced Degradation) testing: Applies high voltage stress to simulate degradation from system voltage exposure

Modules that achieve “Top Performer” status in PVEL scorecards have demonstrated durability well beyond the certification baseline — providing stronger evidence for long-term field performance.

For project finance due diligence — particularly for international lenders, green bond structures, or IFC-aligned financing — PVEL scorecard performance is increasingly a procurement criterion.

IEC 62716 and IEC 61701: Salt Mist and Ammonia Resistance

For Indian installations in specific environments, additional certifications matter:

IEC 61701 — Salt Mist Corrosion: Required for coastal installations (Tamil Nadu, Andhra Pradesh, Kerala, Maharashtra, Gujarat coastal zones). Tests module resistance to salt-laden humid air that causes rapid corrosion of frames, junction boxes, and connectors in coastal climates.

IEC 62716 — Ammonia Resistance: Required for agri-solar (agrivoltaic) installations and locations near agricultural or poultry activity. Ammonia from organic matter can attack EVA encapsulants and junction boxes in concentrations common near farms.

Always check whether your installation environment triggers these additional certification requirements — particularly for agri-solar projects, which are growing rapidly in India.

IEC Certification for Solar Cells: What to Verify

The certifications above cover modules. For solar cells — which are the components that module manufacturers procure from cell manufacturers like Websol — the relevant standards include:

  • IEC 60904 series: Standards for measurement of photovoltaic devices, including I-V curve measurement and cell classification
  • IEC 61853: Module performance testing and energy rating — relevant for cells indirectly through module certification

Cell quality is ultimately validated through the module certification, since cells are tested as part of the finished module. However, for module manufacturers doing incoming cell quality verification, flash testing to IEC 60904-compliant procedures ensures cell performance matches datasheets.

Websol’s solar cells are tested using calibrated flash testers and sorted into tight efficiency bins — ensuring that module manufacturers using Websol cells have a consistent, predictable incoming material.

ALMM and BIS: The Indian Compliance Stack

For any module to be used in Indian government-linked projects, PM Surya Ghar installations, or net metering applications, it must clear the full Indian compliance stack:

  1. IEC 61215 + IEC 61730 — international design qualification and safety
  2. IS 14286 (BIS certification) — Indian national standard
  3. ALMM List-I — MNRE product registry
  4. ALMM List-II (cells) — for DCR projects and post-June 2026 commissioning

Missing any layer invalidates the module for that application. This is why experienced Indian EPCs build compliance verification into their procurement checklists — not as an afterthought after modules arrive on site.

Frequently Asked Questions

Q1. Is IEC certification sufficient for selling solar modules in India?

No. IEC certification is a prerequisite, but Indian sales require additional BIS certification under IS 14286. For government-linked projects, ALMM listing is further required. For DCR projects, ALMM List-II cell compliance is also needed.

Visit bis.gov.in and search for the manufacturer’s BIS licence number as shown on the module datasheet. Verify the licence status, expiry date, and that your specific module model is covered.

IEC 61215 Edition 3 (published 2021) introduced updates including bifacial module testing procedures and revised environmental test sequences. Modules certified to Ed. 2 may have pre-Ed. 3 certifications — both are currently accepted, but new certifications should reference Ed. 3.

Yes. Websol’s solar modules carry the relevant IEC and BIS certifications required for Indian and international markets. For specific certification documentation, contact Websol or download datasheets from the product pages.

Potential Induced Degradation (PID) occurs when high system voltage drives leakage currents through the module, degrading cell efficiency over time. PID is more common in large utility-scale systems with high string voltages. Protection measures include: selecting PID-resistant module designs, using anti-PID inverter settings, ensuring proper system grounding, and sourcing modules with IEC 62804 PID resistance certification.

Yes. IEC 61215 Ed. 3 includes bifacial-specific measurement procedures. Additionally, IEC TS 60904-1-1 provides detailed guidance for bifacial module performance measurement. When evaluating bifacial modules, verify that the bifacial gain claims are supported by IEC-compliant measurement methods.

Privacy Policy

We at Websol Energy System Limited respect the privacy of everyone who visits this website and are committed to maintain the privacy and security of the personal information of all visitors to this website.

Our policy on the collection and use of personal information and other information is outlined below.

In case of visiting this website to read or download information, it must be known that Websol Energy System Limited collects and stores a standard set of internet-related information, such as an Internet Protocol (IP) address, the date and time, the type of browser and operating system used, the pages(s) visited. All information is collected to help Websol Energy System Limited for making this site more useful to its customer(s) and only used for statistical purposes.

Websol Energy System Limited collects and uses information such as name, telephone number, email address, etc. in order to:

  • 1. Respond to queries and requests submitted by you
  • 2. Process bids etc.

Except as set out in this privacy policy, Websol Energy System Limited will not disclose any personally identifiable information without permission, unless Websol Energy System Limited is legally entitled or required to do so or if Websol Energy System Limited believes that it is necessary to protect and/or defend it’s rights, property or personal safety etc.

Change of Privacy Policy

Websol Energy System Limited reserves the full rights to change/alter/amend/modify the contents of the privacy policy from time to time without any prior notice or intimation.

Terms and Conditions

VISITORS TO THIS WEB SITE ARE BOUND BY THE FOLLOWING TERMS AND CONDITIONS (“TERMS”). SO, PLEASE READ THE TERMS CAREFULLY BEFORE CONTINUING TO USE THIS SITE. IF YOU DO NOT AGREE WITH ANY OF THESE TERMS, PLEASE DO NOT USE THIS SITE.

The use of this website is subject to the following terms of use:

  • The content of the pages of this website is for your general information and use only. It is subject to change without notice.
  • This website uses cookies to monitor browsing preferences. If you do allow cookies to be used, personal information may be stored by us for use by third parties.
  • Neither Websol Energy System Limited nor any third parties provide any warranty or guarantee as to the accuracy, timeliness, performance, completeness or suitability of the information and materials found or offered on this website for any particular purpose. You acknowledge that such information and materials may contain inaccuracies or errors and we expressly exclude liability for any such inaccuracies or errors to the fullest extent permitted by law.
  • Your use of any information or materials on this website is entirely at your own risk, for which Websol Energy System Limited shall not be liable. It shall be your own responsibility to ensure that any products, services or information available through this website meet your specific requirements.
  • This website contains material which is owned by or licensed to us. This material includes, but is not limited to, the design, layout, look, appearance and graphics. Reproduction is prohibited other than in accordance with the copyright notice, which forms part of these terms and conditions.
  • The  trade mark “” and all products and logos denoted with trade mark are trademarks of Websol Energy System Limited. This trade mark may not be used in connection with any product or service that is not a Websol Energy System’s product, functions or service.

  • Unauthorized use of this website may give rise to a claim for damages and/or be a criminal offence.
  • From time to time this website may also include links to other websites. These links are provided for your convenience to provide further information. They do not signify that Websol Energy System Limited endorse the website(s).
  •  
  • Applicable Law and Jurisdiction of this WEBSITE are governed by and to be interpreted in accordance with laws of India, without regard to the choice or conflicts of law provisions of any jurisdiction. The user/site visitor agrees that in the event of any dispute arising in relation to this Disclaimer or any dispute arising in relation to the web site whether in contract or tort or otherwise, to submit to the jurisdiction of the courts located at Kolkata (W.B.) only for the resolution of all such disputes.

Legal Disclaimer​

Copyright Notice

Websol Energy System Limited retains copyright on all the text, contents, graphics and trademarks displayed on this site. All the text, graphics and trademarks displayed on this site are owned by Websol Energy System Limited.

General Information Disclaimer

The information on this site has been included in good faith and is for general purpose only and should not be relied upon for any specific purpose. The user shall not distribute text or graphics to others without the express written consent of Websol Energy System Limited. The user shall also not, without Websol Energy System Limited’s  prior permission, copy and distribute this information on any other server, or modify or reuse text or graphics on this or any another system.

Accuracy of Information

Although Websol Energy System Limited tries to ensure that all information and recommendations, whether in relation to the products, services, offerings or otherwise (hereinafter “information”), provided as part of this website is correct at the time of inclusion on the web site, Websol Energy System Limited does not guarantee the accuracy of the Information. Websol Energy System Limited makes no representations or warranties as to the completeness or accuracy of Information. Certain links in this site connect to other Web Sites maintained by third parties over whom Websol Energy System Limited has no control. Websol Energy System Limited makes no representations as to the accuracy or any other aspect of information contained in such other Web Sites.

Third-Party Links

Certain links in this site connect to other websites maintained by third parties over whom Websol Energy System Limited has no control. Websol Energy System Limited makes no representations as to the accuracy or any other aspect of information contained in such other websites.

Warranty Disclaimer

Websol Energy System Limited hereby disclaims all warranties and conditions with regard to this information, including all implied warranties and conditions of merchantability, fitness for any particular purpose, title and non-infringement.

Limitation of Liability

In no event will Websol Energy System Limited, agents or employees thereof be liable for any decision made by the user and/or site visitor for any inference or action taken in reliance on the information provided in this site or for any consequential, special or similar damages.

Applicable Law and Jurisdiction

Applicable Law and Jurisdiction of this Disclaimer are governed by and to be interpreted in accordance with laws of India, without regard to the choice or conflicts of law provisions of any jurisdiction. The user/site visitor agrees that in the event of any dispute arising in relation to this Disclaimer or any dispute arising in relation to the website whether in contract or tort or otherwise, to submit to the jurisdiction of the courts located at Kolkata (West Bengal) (India) only for the resolution of all such disputes.

Forward-Looking Statements

Except for the historical information herein, statements in this website, which include words or phrases such as “will”, “aim”, “will likely result”, “would”, “believe”, “may”, “expect”, “will continue”, “anticipate”, “estimate”, “intend”, “plan”, “contemplate”, “seek to“, “future”, “objective”, “goal”, “likely”, “project”, “should”, “potential”, “will pursue”, and similar expressions or variations of such expressions may constitute “forward-looking statements”. These forward-looking statements involve a number of risks, uncertainties and other factors that could cause actual results to differ materially from those suggested by the forward-looking statements. These risks and uncertainties include, but are not limited to our liability to successfully implement our strategy, our growth and expansion plans, obtain regulatory approvals, our provisioning policies, technological changes, investment and business income, cash flow projections, our exposure to the market risks as well as other risks. The company does not undertake any obligation to update forward-looking statements to reflect events or circumstances after the date thereof.